Published on March 26, 2020
With the immune system as a central focus during the recent weeks, GrassrootsHealth has shared several posts about the essential role of vitamin D in immune functioning. Vitamin D has also been in the news as an important nutrient to consider taking during the COVID-19 pandemic, including an editorial by the former director of the CDC.
In this post, we will share more information of how vitamin D is related to a decrease in flu and flu-like illnesses by discussing the relationship between seasonal flu activity and vitamin D levels, the correlation between vitamin D levels and the incidence of flu and flu-like symptoms in the GrassrootsHealth cohort (an updated analysis), and the status of vitamin D in the US and GrassrootsHealth populations.
We hope this information will help make clear the importance of vitamin D, and knowing what your vitamin D level is, for flu prevention, immune strength, and overall health.
Why is the Flu More Common in Winter?
October is generally the month when we start to see an increase in cold and flu activity, with flu activity peaking between December and March. What might contribute to this pattern, and how might vitamin D factor into it? What can you do to decrease your chances of getting the cold or flu, or lessen its severity and symptoms if you do get it?
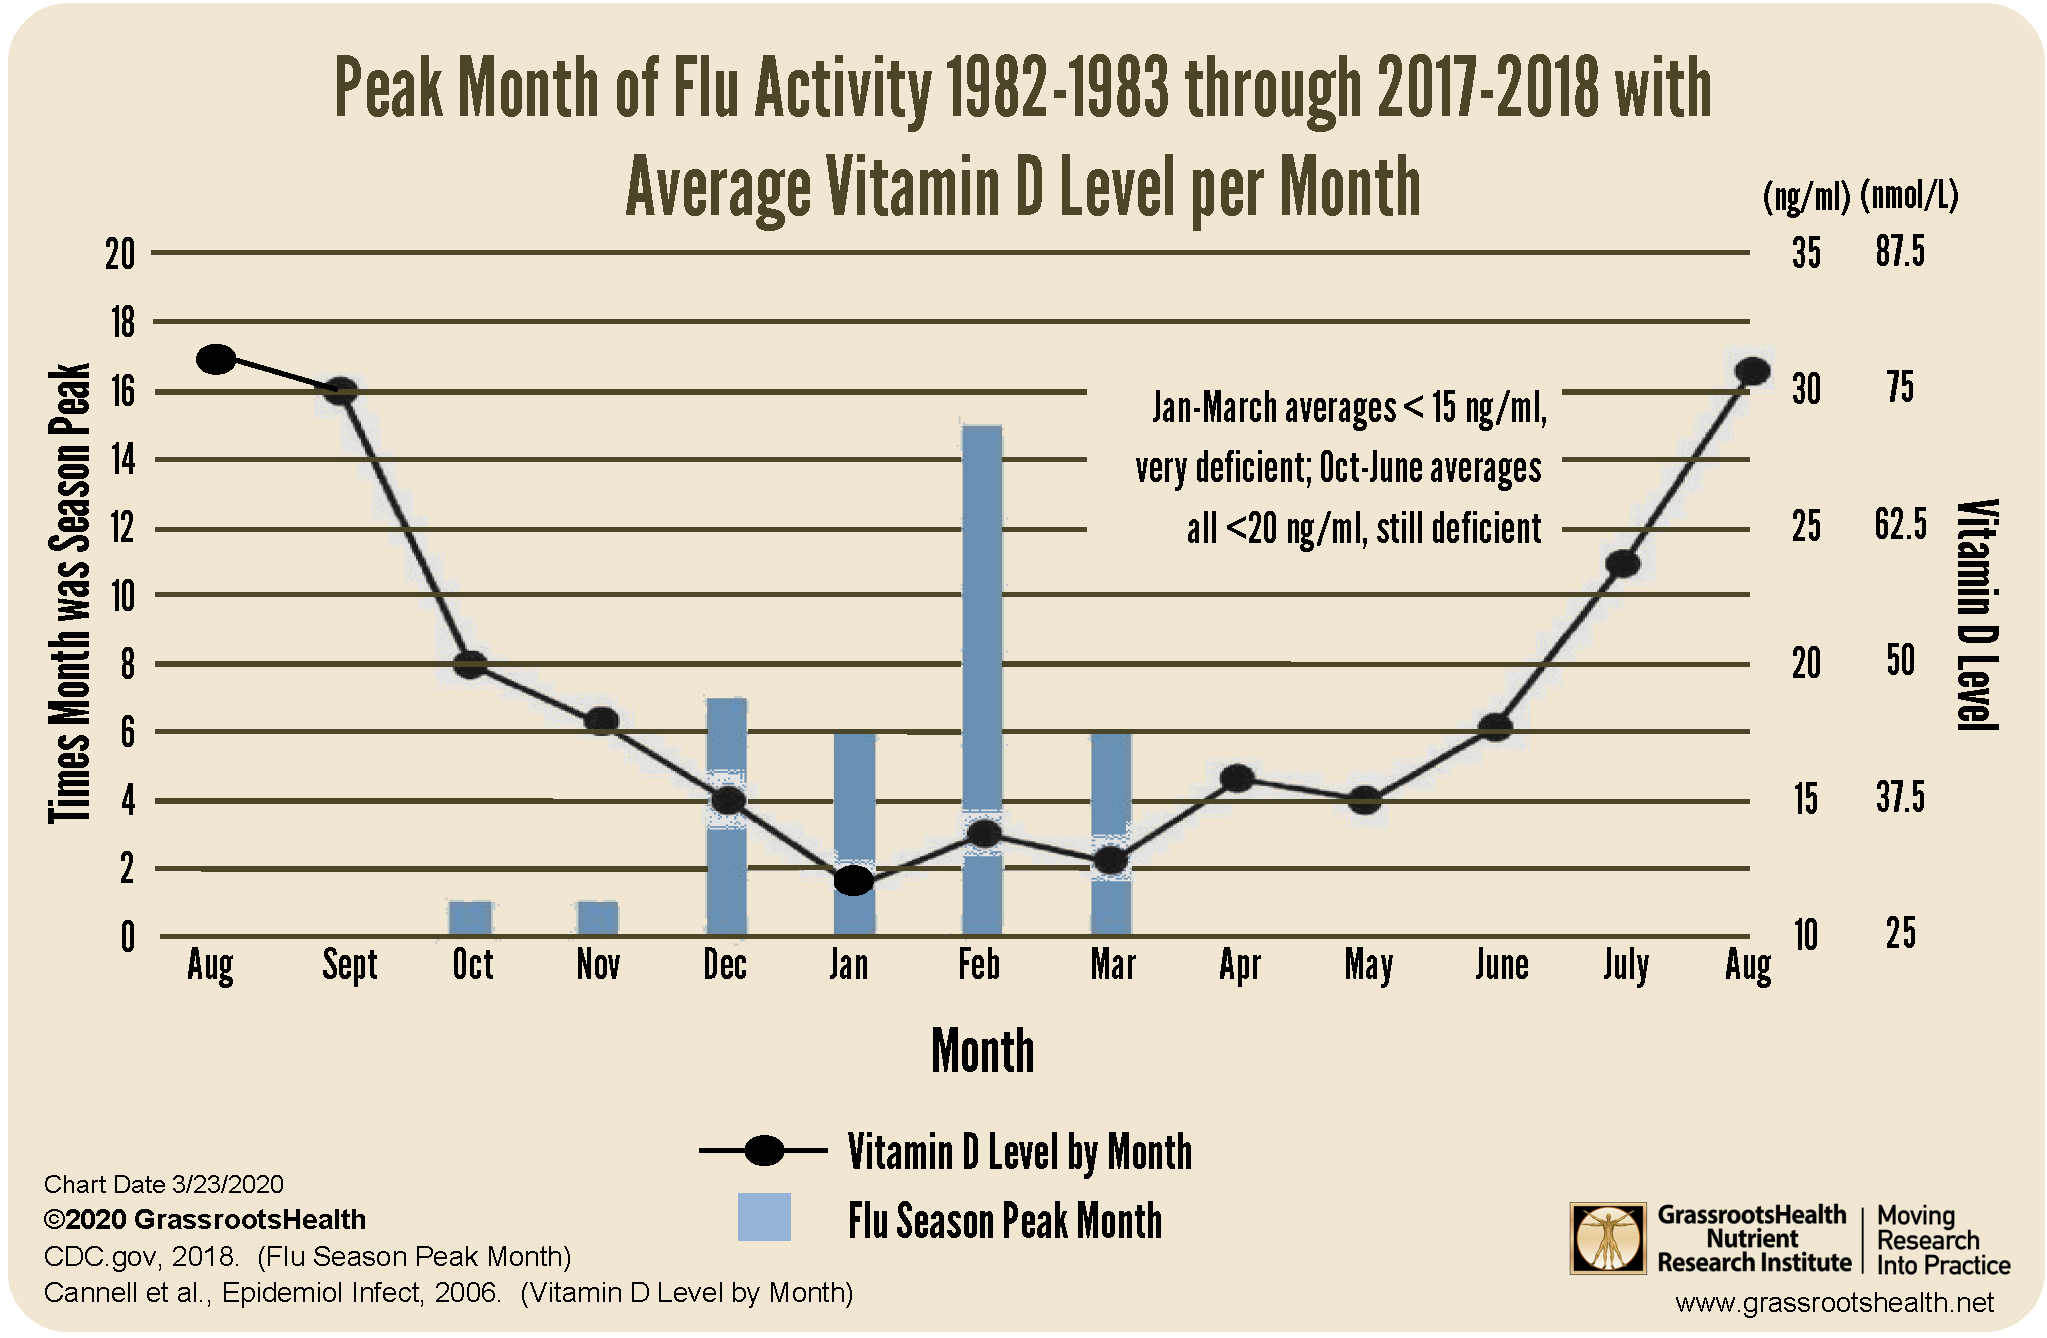
Over the past 34 years, February has been the most common month for peak flu activity.
There are two basic reasons that contribute to increased flu activity in winter:
- The influenza virus lives longer outside the human body when it is cold and dry, resulting in the flu season starting in late fall as cold air reduces the absolute humidity of the air.
- Vitamin D levels tend to be lower in winter.
An Illustration of Peak Flu Months with Monthly Vitamin D Levels
The chart below combines data from two different charts shared previously. The line chart is figure 3 from the research paper, “Epidemic Influenza and Vitamin D,” which graphs the seasonal variation of vitamin D levels of inhabitants, aged 50-80 years, of a small southern German town. As can be seen in that graph, vitamin D levels tend to decrease dramatically between September and October, with the lowest levels in January through March. The bar chart, provided by the CDC, shows peak flu activity by month, with the number of times over the past 35 years a particular month has recorded the peak flu activity of a season. Peak months have been October through March, with the most frequent in February.
Taking both charts together, you can see that flu activity tends to peak during the same time vitamin D levels are at their lowest.
Is there an association between vitamin D levels and the incidence of flu and flu-like symptoms?
In the GrassrootsHealth questionnaire that accompanies each vitamin D test, participants are asked whether they had the flu in the previous 6 months. What do we see when looking at this data and comparing it to those participants’ vitamin D levels?
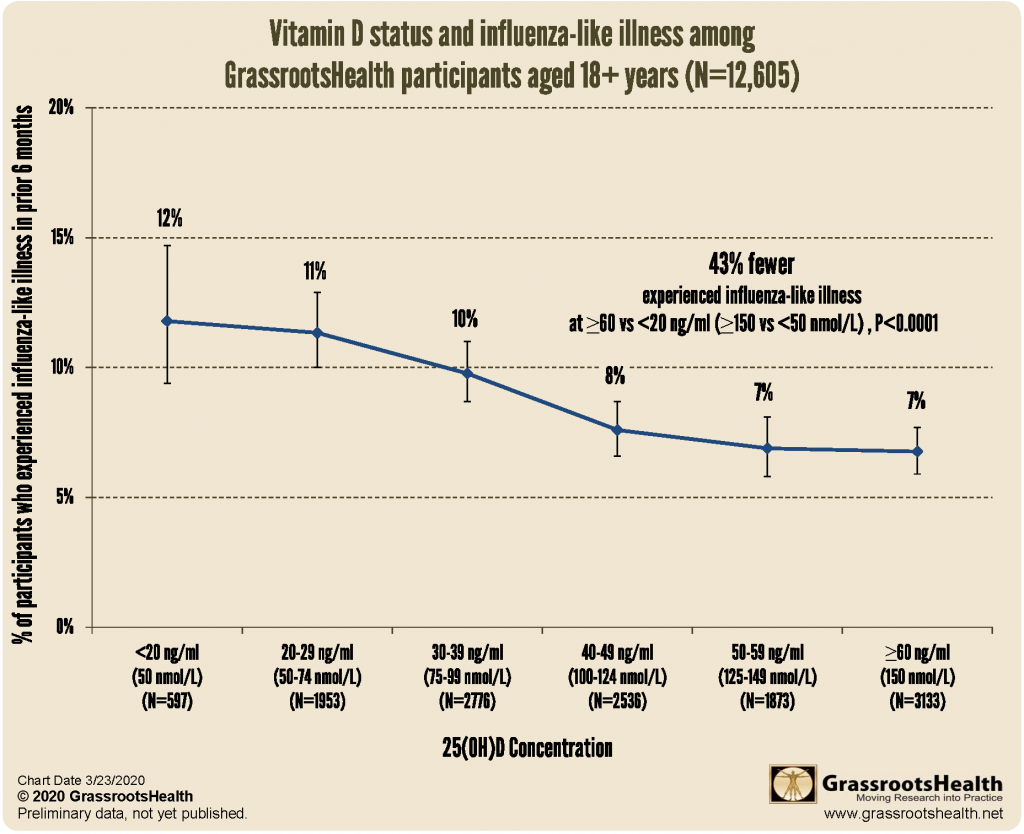
A recent analysis included 12,605 adult participants aged 18+ years (N=12,605), and was broken down to determine the percent of participants who indicated that they had experienced the flu for the following vitamin D concentration groups: <20, 20-39, 30-39, 40-49, 50-59, and ≥60 ng/ml. Those with vitamin D level at or above 60 ng/ml had a 43% lower risk of flu-like illness compared to those with vitamin D levels less than 20 ng/ml (P<0.0001). The lower level, 20 ng/ml, is used specifically because it is the point that the Institute of Medicine considered ‘sufficient’; the minimum upper level, 60 ng/ml, is used because the GrassrootsHealth Scientists’ Panel of 48 vitamin D researchers created a consensus statement that the recommended range is 40-60 ng/ml.
Compared to those with vitamin D levels less than 20 ng/ml, 43% fewer of those with levels at or above 60 ng/ml experienced flu-like illnesses. When adjusted for age and season, which were also significant predictors (P<0.05), those with levels at or above 60 ng/ml had a 27% lower risk of illness than those with levels less than 20 ng/ml (P=0.03). Higher vitamin D levels were associated with a dose-response decrease in flu risk with concentrations ≥40 ng/ml being most protective.
What is the Chance that You Are Vitamin D Deficient?
GrassrootsHealth has used the National Health and Nutrition Examination Survey (NHANES, 2009-2014) data to look at rates and trends of vitamin D deficiency in the United States in both adults and children and how it compares to the GrassrootsHealth cohort (US participants who tested anytime in 2009 through 2014). With recent NHANES data sets, lab results from across the years have been standardized when different lab testing was used, allowing for a more accurate comparison. Below are a few illustrations of vitamin D levels in the US population, compared to those of participants in the GrassroostHealth cohort.
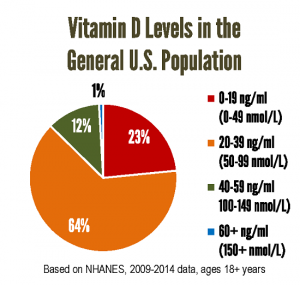 | 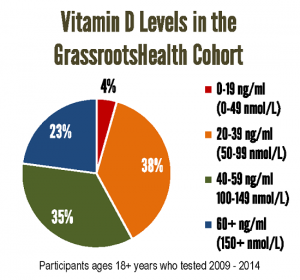 |
The pie charts above clearly show the difference in distribution in vitamin D levels among adults. Those in the GrassrootsHealth cohort have significantly higher levels than those in the NHANES cohort; in fact, almost 90% of U.S. adults in the NHANES data set have a vitamin D level below the recommended range of 40-60 ng/ml!!
To note, GrassrootsHealth participants consist of individuals and, in the case of children, have parents who are generally educated about vitamin D and have tested their level at least once.
Adults
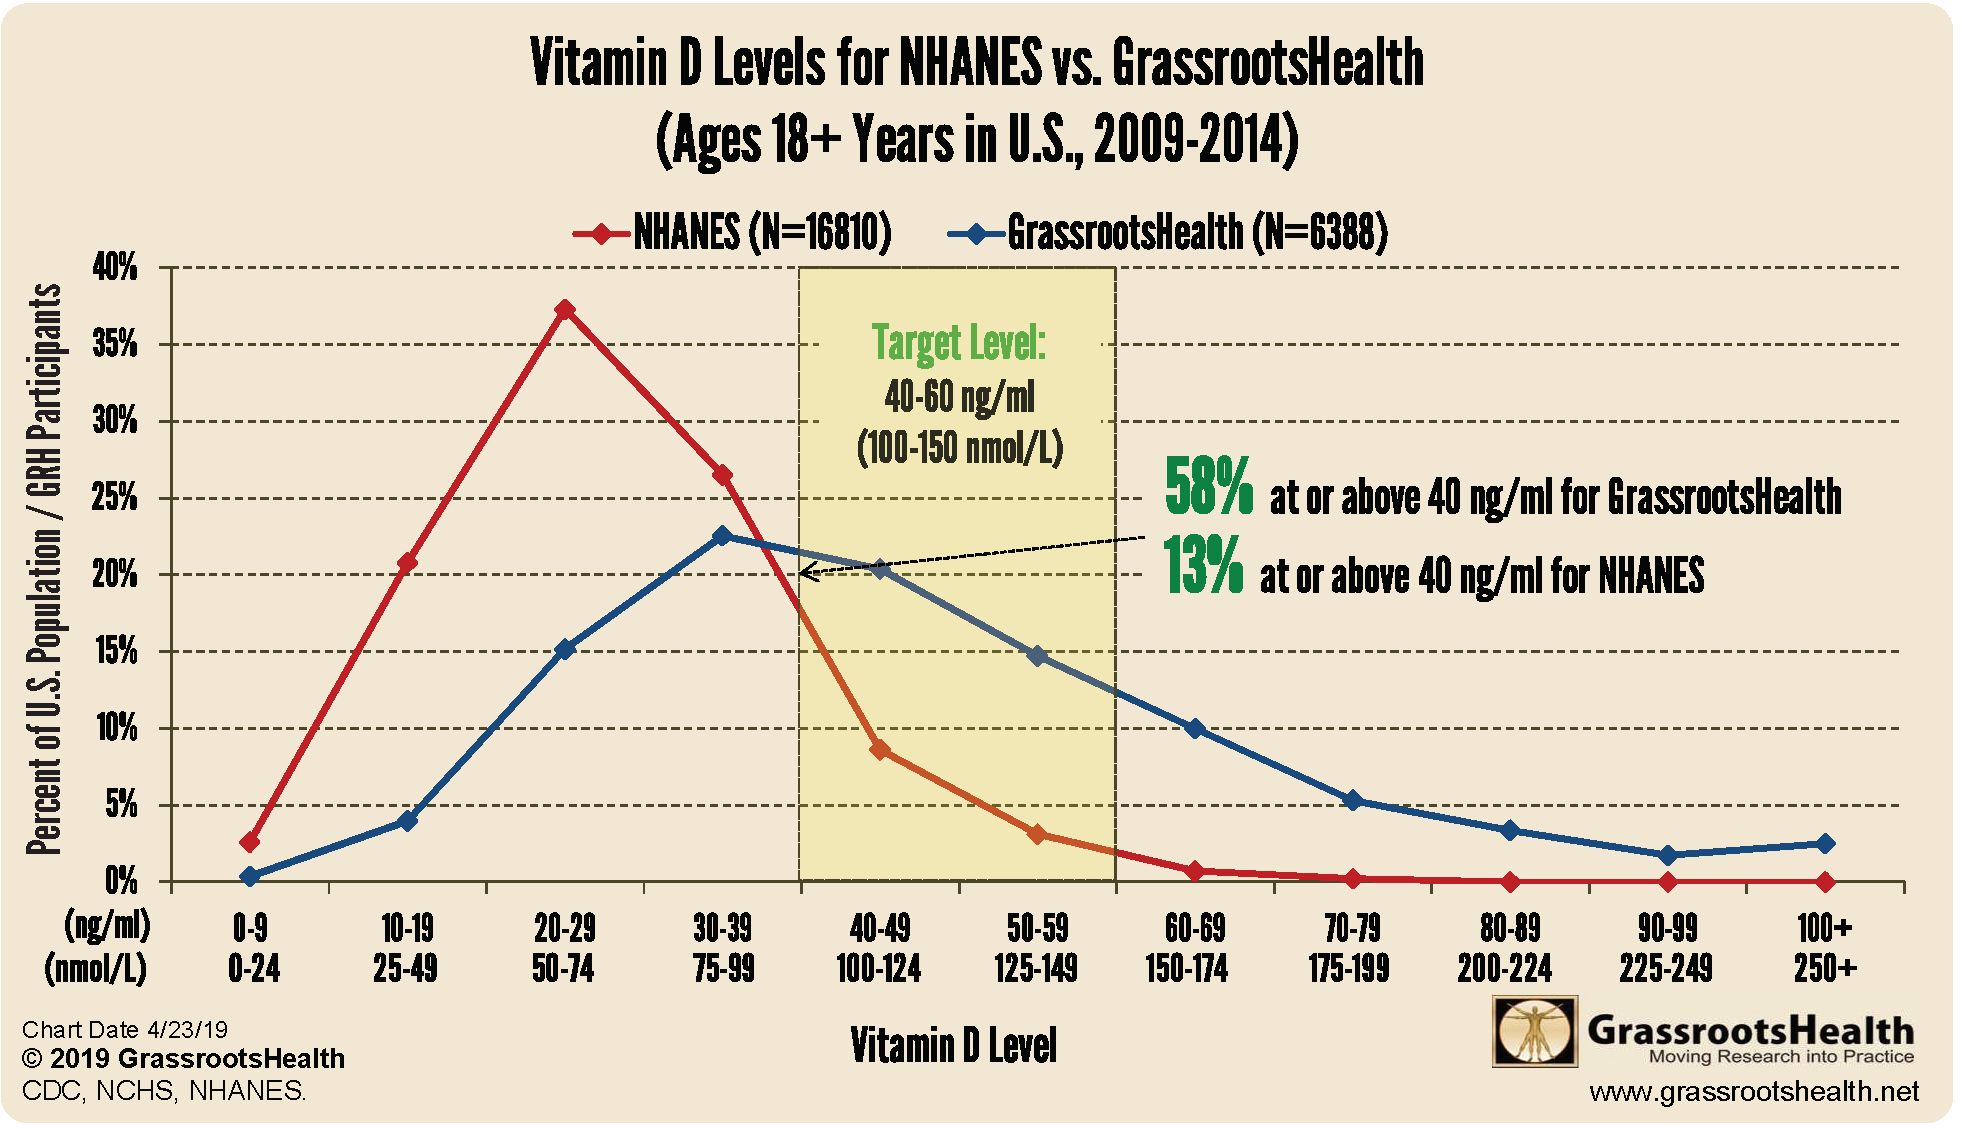
This chart illustrates the difference between vitamin D serum levels in adults in the NHANES cohort vs the GrassrootsHealth cohort (ages 18+ years):
- Adults in the GrassrootsHealth cohort have significantly higher levels than those in the NHANES cohort
- 58% of adults in the GrassrootsHealth cohort have levels at or above 40 ng/ml compared to 13% in the NHANES cohort
- 4% of adults in the GrassrootsHealth cohort have levels below 20 ng/ml compared to 23% in the NHANES cohort
- Almost 90% of U.S. adults in the NHANES data set have a vitamin D level below the recommended range of 40-60 ng/ml
Children & Teens
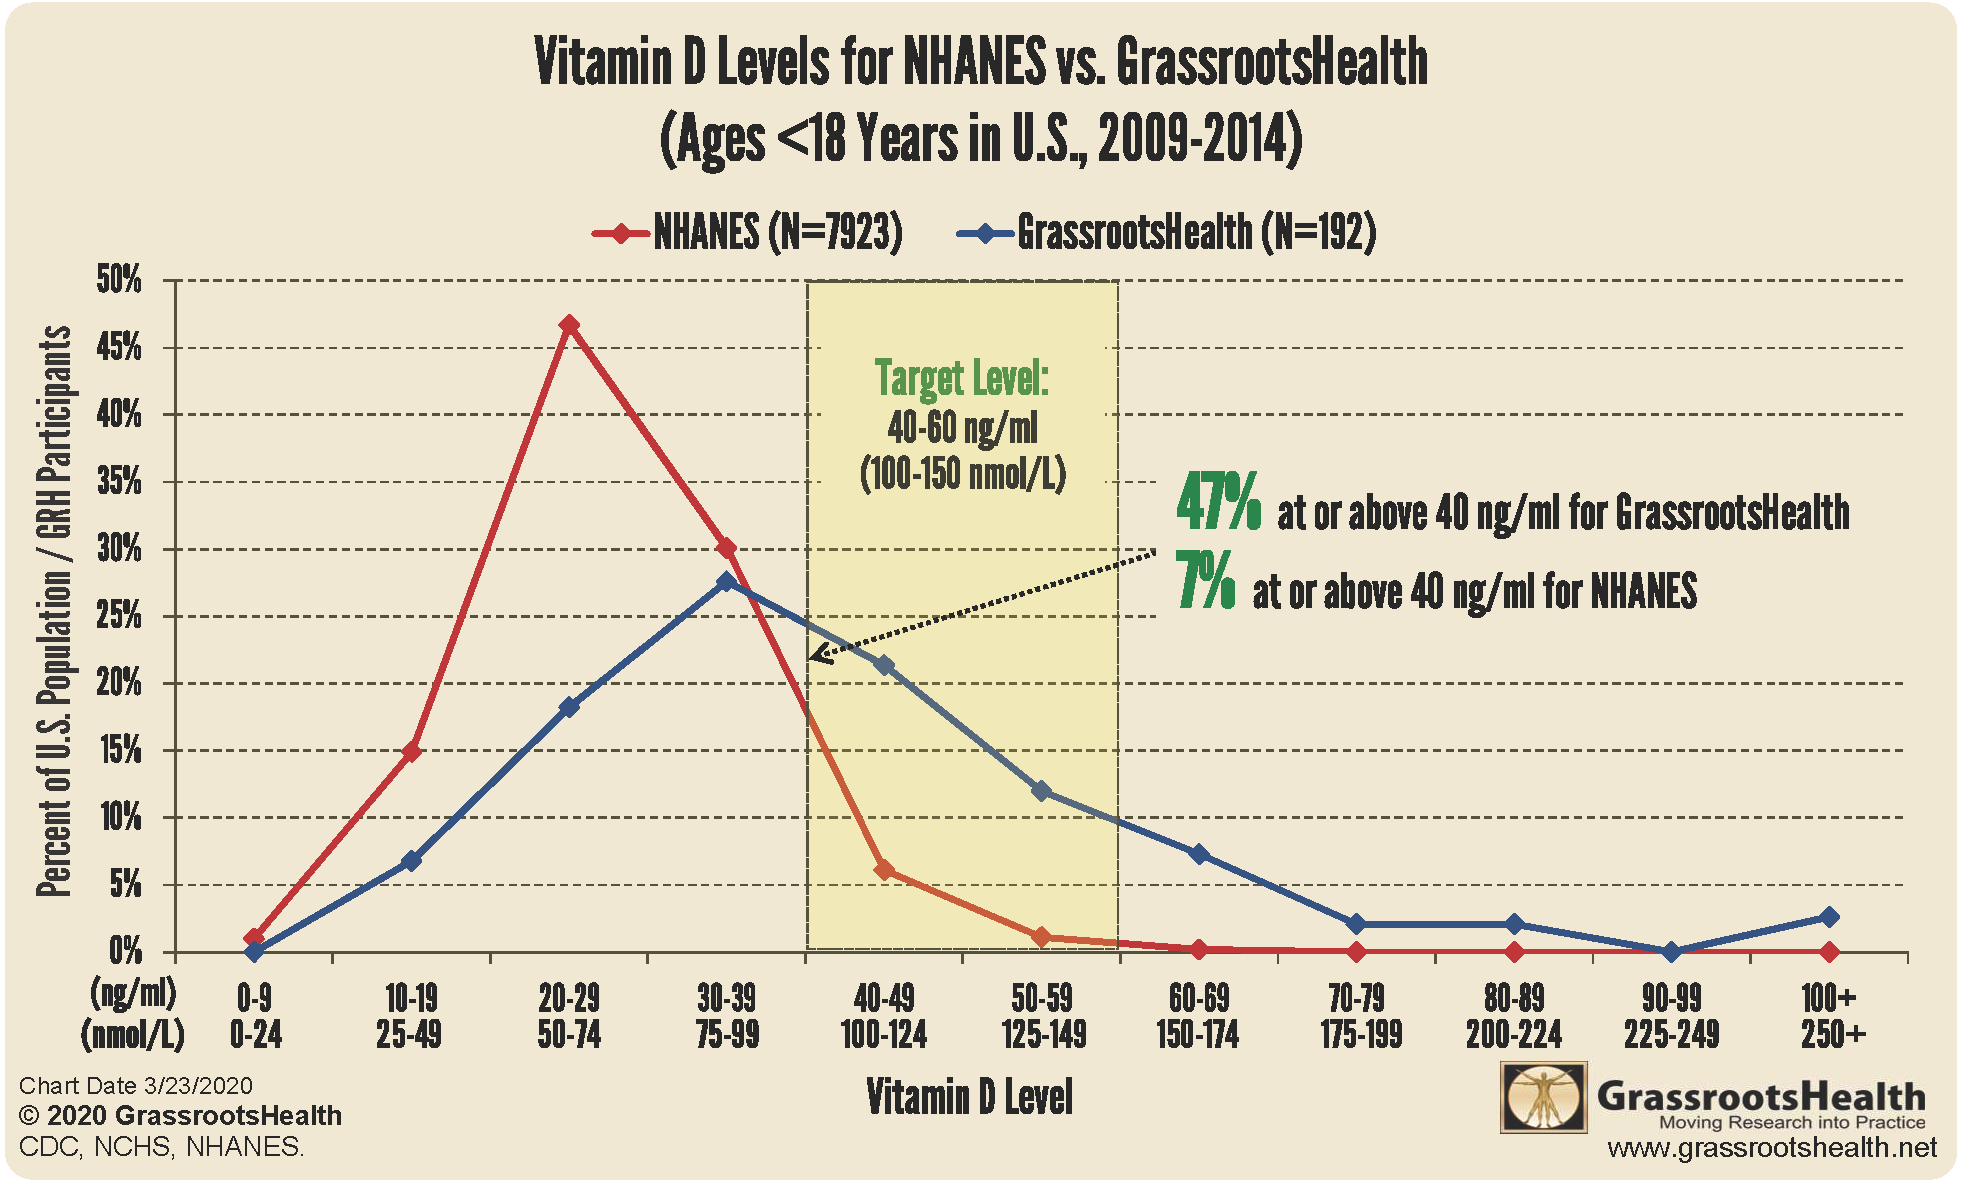
This chart illustrates the difference between vitamin D serum levels in children and teens in the NHANES cohort vs the GrassrootsHealth cohort (ages <18):
- Children and teens in the GrassrootsHealth cohort have significantly higher levels than those in the NHANES cohort
- 47% of children and teens in the GrassrootsHealth cohort have levels at or above 40 ng/ml compared to 7% in the NHANES cohort
- 7% of children and teens in the GrassrootsHealth cohort have levels below 20 ng/ml compared to 16% in the NHANES cohort
- More than 90% of U.S. children and teens in the NHANES data set had a vitamin D level below the recommended range of 40-60 ng/ml
Why Supplementing Without Testing is NOT the Best Guide for Your Personal Health
There is a wide variation in how well an individual responds to a specific dose of vitamin D, making it difficult to know how much to take without testing the vitamin D level. The GrassrootsHealth cohort is a great example of how the simple act of measuring vitamin D levels, combined with taking the necessary steps to achieve a target level, result in an overall improvement in vitamin D levels compared to the general population.
If you choose to supplement without testing, please be aware that from the Institute of Medicine Report of 2011, they stated that 10,000 IU/day was the ‘NOAEL’—the no observed adverse event level, i.e., this is considered safe. There have been many studies since that time showing that serum levels in the range of 40-60 ng/ml (100-150 nmol/L) are necessary for health and that there is a considerable variation in intake to achieve that— which is why we always encourage you to test, so you know what dose is right for YOU!
Know YOUR Vitamin D Level! Get it to the range of 40-60 ng/ml (100-150 nmol/L)
Help reduce your risk of flu-like illnesses. Testing your vitamin D level regularly and taking daily steps to keep it at a target level of 40-60 ng/ml (100-150 nmol/L) is important for all stages of health. Through GrassrootsHealth Nutrient Research Institute, you can also test your essential elements magnesium, copper, zinc and selenium, toxins such as lead, mercury and cadmium, as well as your omega-3 levels, inflammation levels and thyroid stimulating hormone (TSH) level. Find out your levels today! Log on to the test selection page (click the link below) to get your tests and see for yourself if your levels can be improved.
Make sure you track your results before and after, about every 6 months!
How can I track my nutrient intake and levels over time?
To help you track your supplement use and nutrient levels, GrassrootsHealth has created the Personal Health Nutrient Decision System called
For each specific supplement, you can track what days you take it, how much, and many other details. This will help you know your true supplemental intake and what patterns of use work for you to reach and maintain optimum nutrient levels. Check it out today!


