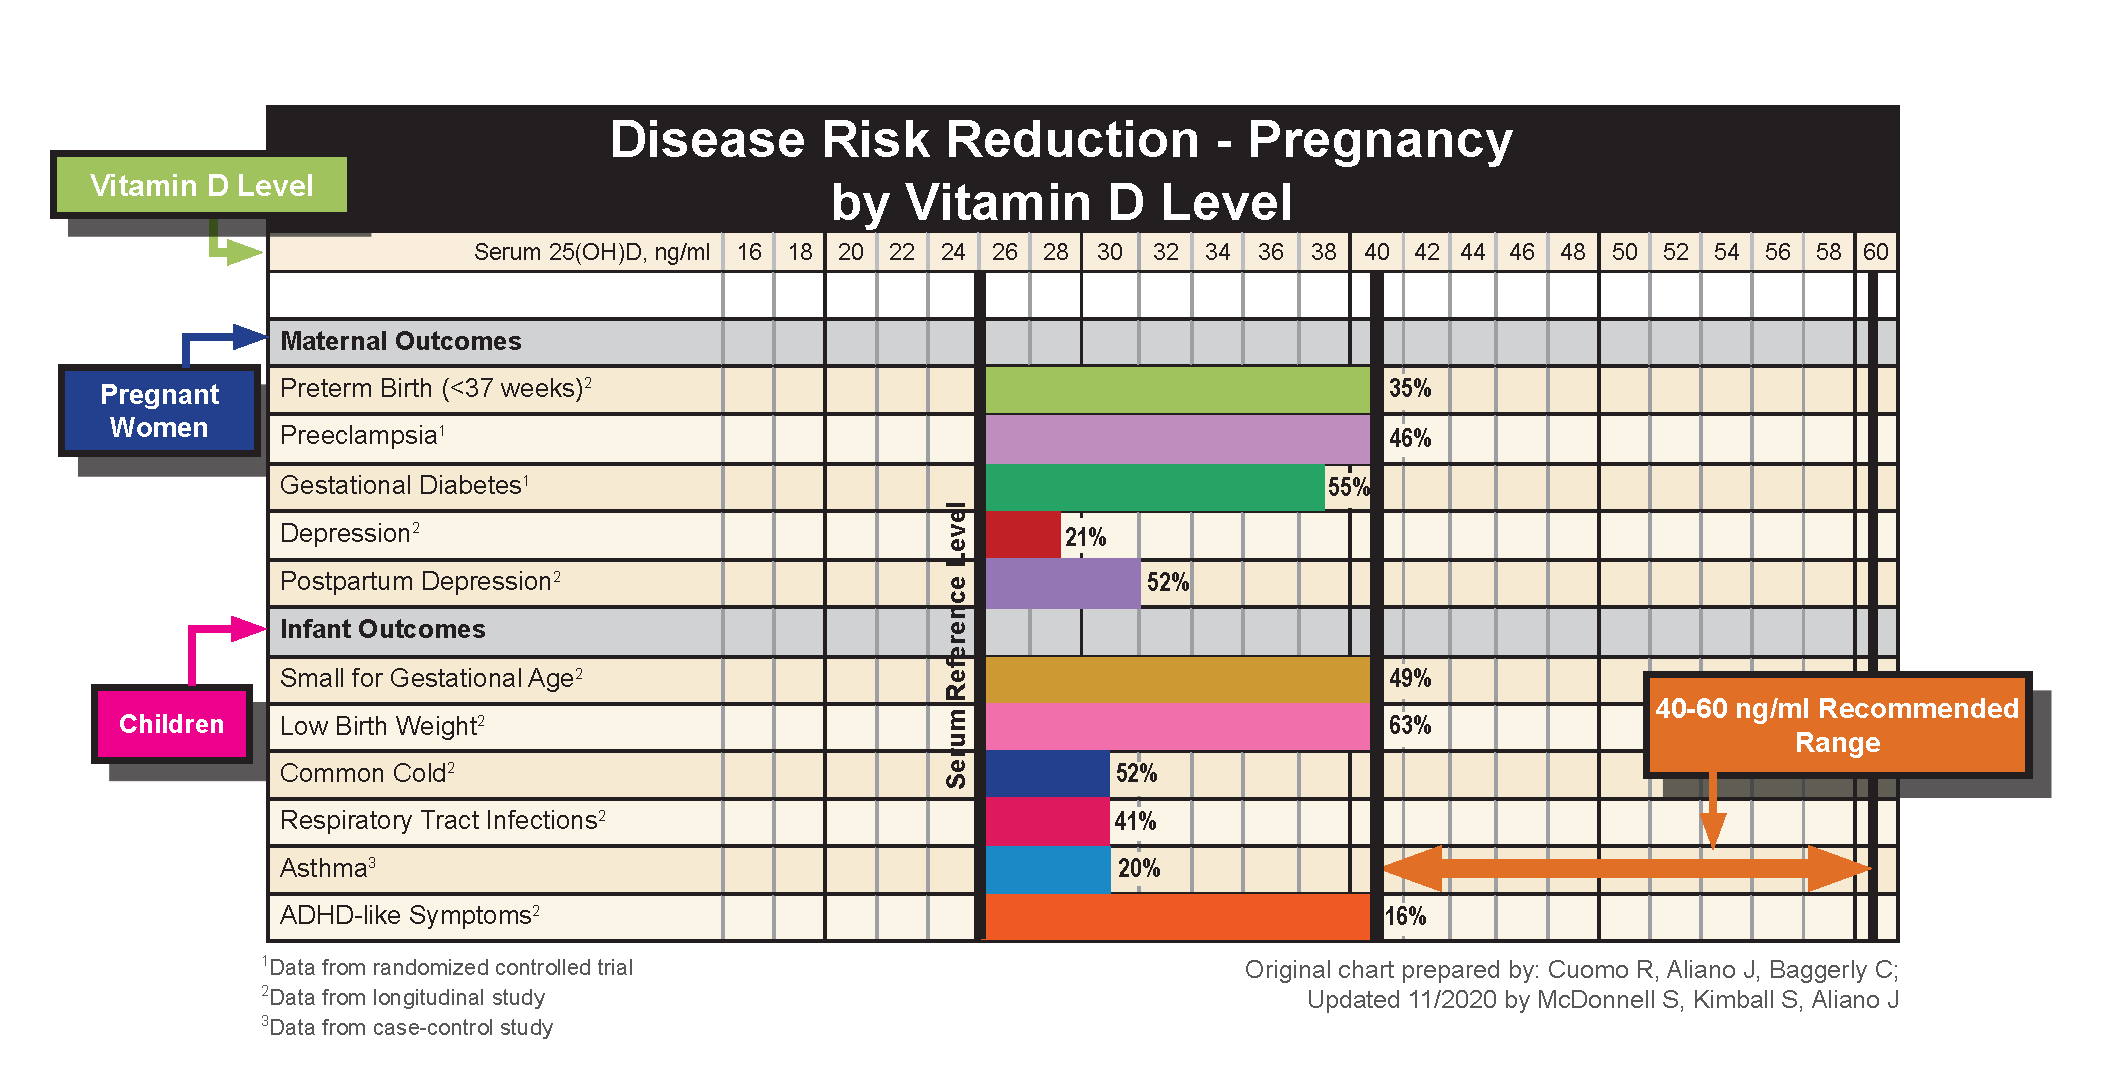
Disease Risk Reduction Chart – Pregnancy & Children
Results from multiple studies regarding the association between vitamin D level and various conditions in pregnancy and early childhood were summarized according to a common reference level of 25 ng/ml (63 nmol/L), the approximate average level in the U.S. population.
The percent reductions represent what could be expected in the general population if concentrations were raised to the concentrations specified on the chart.
There were significant reductions in disease risk with increasing vitamin D levels. Ensuring a vitamin D level in the range of 40-60 ng/ml during pregnancy is an effective way to reduce the risk of complications.

How was this chart created?
There are many studies that have been published concerning the role of vitamin D in maternal and infant outcomes – some of which report conflicting results. You may ask how we chose the studies we did.
We began by reviewing whether there was a known mechanism for how vitamin D would play a role in each outcome. We then reviewed meta-analyses published in the previous two years because they included the most recent data available. Meta-analyses combine the results of observational studies and/or randomized control trials to determine an overall effect of vitamin D on their outcome of interest. Several meta-analyses have found that vitamin D deficiency is associated with the development of many adverse pregnancy-related conditions and infant outcomes, and that vitamin D supplementation improves those outcomes.
To select studies for the Pregnancy Disease Risk Reduction Chart, we reviewed the trials included in the meta-analyses and studies published after the meta-analyses were reported to identify studies that reported data we could use. The study needed to report statistically significant disease risk reduction in relation to vitamin D levels, more specifically serum 25(OH)D levels. Also, the analysis needed to include vitamin D levels above the reference level of 25 ng/ml. Of the identified studies, those selected for the chart had the highest levels of evidence (RCT, longitudinal, then case-control), included participants with the broadest range of vitamin D levels, and had the largest study populations.
Additional Versions:
Chart Date: 3/23/10; Updated: 11/20/20
Format: PDF
Dimensions: 8.5 x 11
Pages: 1
