Published on November 8, 2021

New study shows significant relationship between changes in vitamin D levels and changes in lipid levels, with decreasing vitamin D linked to worsening lipid profile
Key Points
- A year to year comparison found a significant decrease in TC, LDL-C, and TG levels among individuals whose vitamin D level had increased by 10 ng/ml or more, and an increase in TC, LDL-C, and TG levels among those whose vitamin D level had decreased by 10 ng/ml or more
- Changes in HDL-C were observed alongside changes in vitamin D levels, but these changes were slight and not statistically significant for all groups
- This study supports previous research showing that reductions in vitamin D levels are associated with worsening lipid profiles, and the authors suggest that vitamin D supplementation may be of benefit for individuals with dyslipidemia
 Several questions about vitamin D and cholesterol levels have been asked of us in the past, such as “Does increasing my vitamin D level or supplementing with vitamin D raise cholesterol levels,” or “Do vitamin D levels change with cholesterol levels?” While there have been a small handful of studies and trials on the subject, we have not had any specific answers for those questions up until this point. A paper recently published helps to shed light on the topic, and is reviewed below.
Real-World Data Reveals Relationship between Year to Year Changes in Vitamin D and Lipid Levels
In an effort to further clarify the relationship between vitamin D and lipid levels, Li et al. analyzed data from a real-world setting, using laboratory measurements obtained from an annual employee health program. Their goal was to see if there was a consistent, significant relationship between year-to-year increases or decreases in vitamin D levels and changes in serum lipid levels. They split the data into cohorts according to year:
- Cohort 1 contained measurements from 5580 individuals for the years 2017 to 2018
- Cohort 2 contained measurements from 6057 individuals for the years 2018 to 2019
- Cohort 3 contained measurements from 7249 individuals for the years 2019-2020
Each cohort was split into two different groups – those whose vitamin D level increased by 10 ng/ml (25 nmol/L) or more from one year to the next, and those whose vitamin D level decreased by 10 ng/ml or more. Changes in total cholesterol (TC), low-density lipoprotein cholesterol (LDL-C), high-density lipoprotein cholesterol (HDL-C), and triglycerides (TG) were also evaluated for each of the two groups within each cohort.
Increasing Vitamin D Levels Linked to Decreased Cholesterol Measures
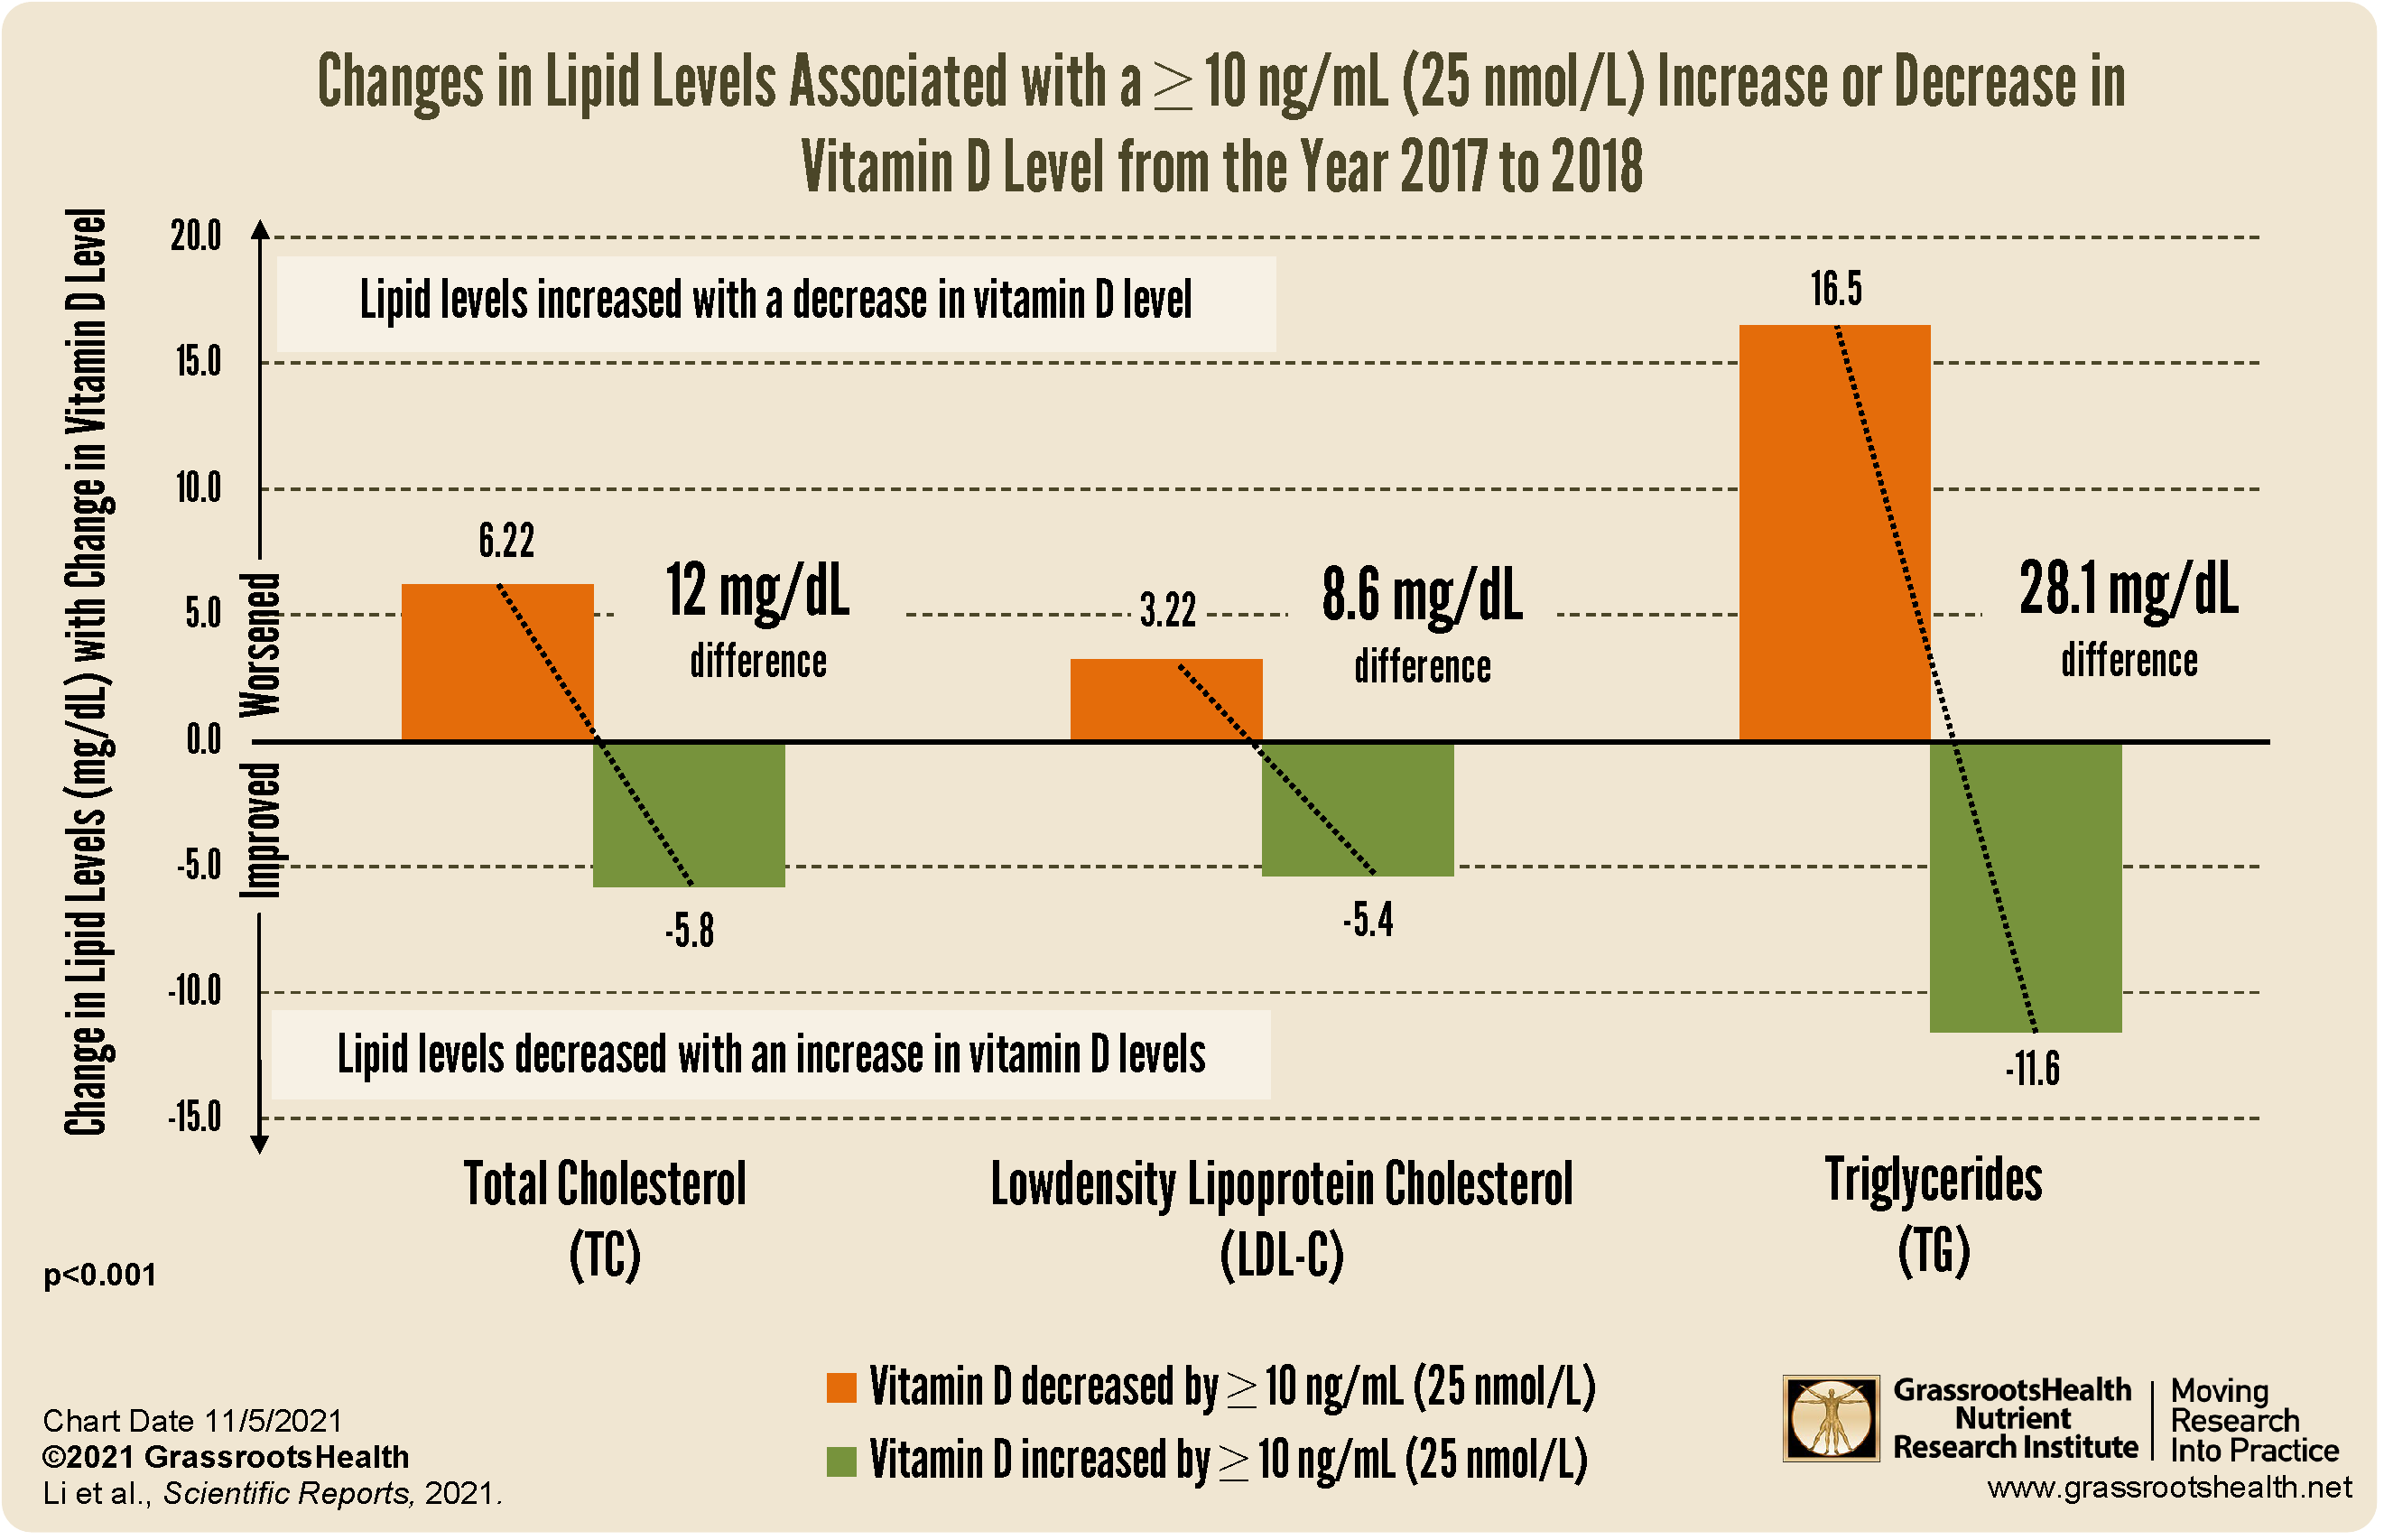
For each year to year comparison, the authors found a significant decrease in TC, LDL-C, and TG levels among those whose vitamin D level had increased by 10 ng/ml or more. They also found a significant increase in TC, LDL-C, and TG levels among those whose vitamin D level had decreased by 10 ng/ml or more.
 Click to Enlarge & Print
As can be seen in the chart above, where orange bars indicate decreasing vitamin D levels and green bars indicate increasing vitamin D levels, TC, LDL-C, and TG levels increased (worsened) when the vitamin D level went down by at least 10 ng/ml (25 nmol/L) over the year, and decreased (improved) when vitamin D level went up by at least 10 ng/ml over the year. For those whose vitamin D levels increased by 10 ng/ml (25 nmol/L) or more, compared to those whose levels decreased, there was an approximate reduction in
- Total Cholesterol by 10-12 mg/dL
- LDL-C by 7-8 mg/dL
- And Triglycerides by 21-28 mg/dL
These changes remained significant even after adjusting for age, sex, race, education, BMI, blood pressure, smoking status, geographical location, vitamin D level at baseline, and lipid level at baseline. While changes in HDL-C were observed, these changes were slight and not statistically significant for all groups.
In summary, this study showed that
“individuals who had year-over-year increases in vitamin D levels tended to have corresponding decreases in levels of TC, LDL-C, and TG. Conversely, individuals who had year-over-year decreases in vitamin D levels tended to have increases in TC, LDL-C, and TG levels.”
These findings support previous research showing that reductions in vitamin D levels are associated with worsening lipid profiles, and with this, the authors suggest that vitamin D supplementation may be of benefit for individuals with dyslipidemia.
Vitamin D is an Easily Modifiable Factor to Help Improve Disease Outcomes – Make Sure You Are Getting Enough
 Having and maintaining healthy vitamin D levels and other nutrient levels can help improve your health now and for your future. Choose which to measure, such as your vitamin D, omega-3s, and essential minerals including magnesium and zinc, by creating your custom home test kit today. Take steps to improve the status of each of these measurements to benefit your overall health. You can also track your own intakes, symptoms and results to see what works best for YOU.
Enroll and test your levels today, learn what steps to take to improve your status of vitamin D (see below) and other nutrients and blood markers, and take action! By enrolling in the GrassrootsHealth projects, you are not only contributing valuable information to everyone, you are also gaining knowledge about how you could improve your own health through measuring and tracking your nutrient status, and educating yourself on how to improve it.
How Can You Use this Information for YOUR Health?
Having and maintaining healthy vitamin D and other nutrient levels can help improve your health now and for your future. Measuring is the only way to make sure you are getting enough!
STEP 1 Order your at-home blood spot test kit to measure vitamin D and other nutrients of concern to you, such as omega-3s, magnesium, essential and toxic elements (zinc, copper, selenium, lead, cadmium, mercury); include hsCRP as a marker of inflammation or HbA1c for blood sugar health
STEP 2 Answer the online questionnaire as part of the GrassrootsHealth study
STEP 3 Using our educational materials and tools (such as our dose calculators), assess your results to determine if you are in your desired target range or if actions should be taken to get there
STEP 4 After 3-6 months of implementing your changes, re-test to see if you have achieved your target level(s)