Published on August 12, 2022

How have you and those around you responded to the latest interpretation of the VITAL trial on fracture rates? Here is the second post of our 3-part response for you to share with others.
Key Points
- Understanding how the body responds to most nutrients (as illustrated by the nutrient-response curves) is important to be able to define the appropriate amount of the nutrient that reduces risk of a specific health outcome
- Most nutrients have many different functions within the body, with response curves varying by system (such as skeletal vs immune) and nutrient responses varying with basal (baseline) and achieved nutrient status, dose/intake, and system-specific sensitivity; for example, the skeletal benefits of vitamin D (to prevent rickets) are seen at much lower levels, while cancer prevention benefits are seen at much higher levels
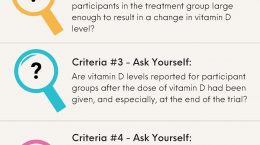
- Because baseline vitamin D levels and follow-up levels were not measured for all participants, and because the study inclusion criteria did not take into account the baseline vitamin D status, the LeBoff paper only partially met two of the 5 nutrient study criteria for some of the participants included in the study, and did not meet those criteria for many of the other participants; the remaining 3 criteria will be reviewed in our final post of this series
 In our last post, we introduced the latest publication using the VITAL trial data, authored by LeBoff et al., titled “Supplemental Vitamin D and Incident Fractures in Midlife and Older Adults.” This publication concluded that vitamin D supplementation did not reduce the risk of fracture compared to placebo among their study population, and the publicity that followed prompted many to question the usefulness of vitamin D in general.
In Part 1, we discussed the importance of looking at the “Totality of Evidence” when making decisions for our health based on research, as well as how to identify whether specific study criteria were met when conducting and reporting on nutrient research. Following these criteria can be essential to providing accurate and reliable study results, especially when it comes to vitamin D.
Key Concept: Understanding How the Body Responds to Nutrients
Before digging into each of the specific nutrient study criteria, a key concept to understanding their importance can be illustrated by the following nutrient response curves. Understanding this curve is important to be able to define the appropriate amount of the nutrient that reduces risk of a specific health outcome. (This concept is described in detail in the “Nutrition and Medicine Webinar” by Dr. Robert Heaney, from approximately 10:36 to 18:35.)
The way the body responds to most nutrients can be described by an ‘S’ shaped curve, or Sigmoid Response Curve.
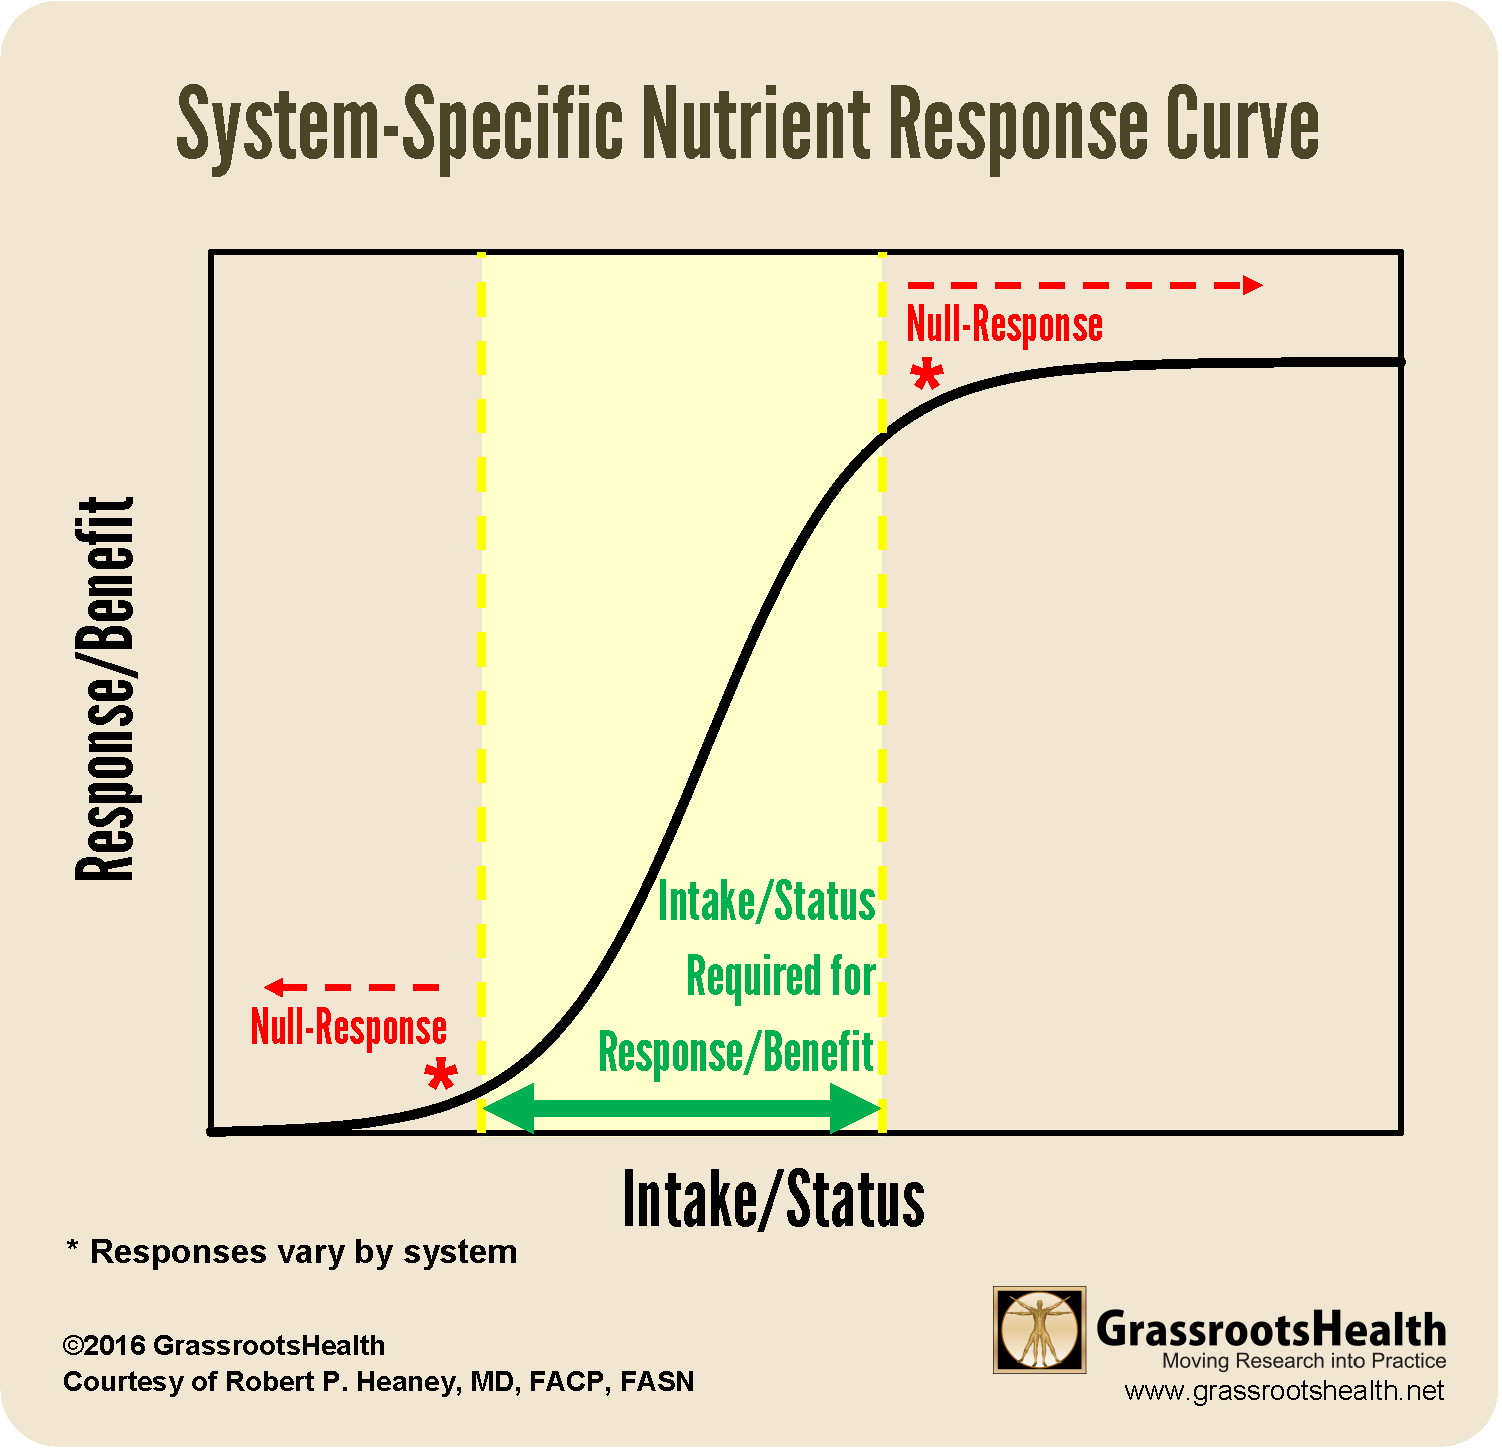
The curve shows how a change in a nutrient’s intake or status affects a particular body system, with the x-axis representing the nutrient intake or status, and the y-axis representing the response or benefit seen within that body system. When observing the nutrient response curve, the following can be seen:
- The benefit provided by the nutrient rises as intake/status rises, up to a certain point (away from deficiency, and before toxicity).
- At each end of the curve are null response regions; too low will not be enough to produce a response, and too high will not produce any further response (response has been maximized).
- The same change in intake (such as dose) or status (such as blood level) may produce a significant response in one system and a null response in another (illustrated further in the chart following).
For example, consider the effect of vitamin D on bone strength:
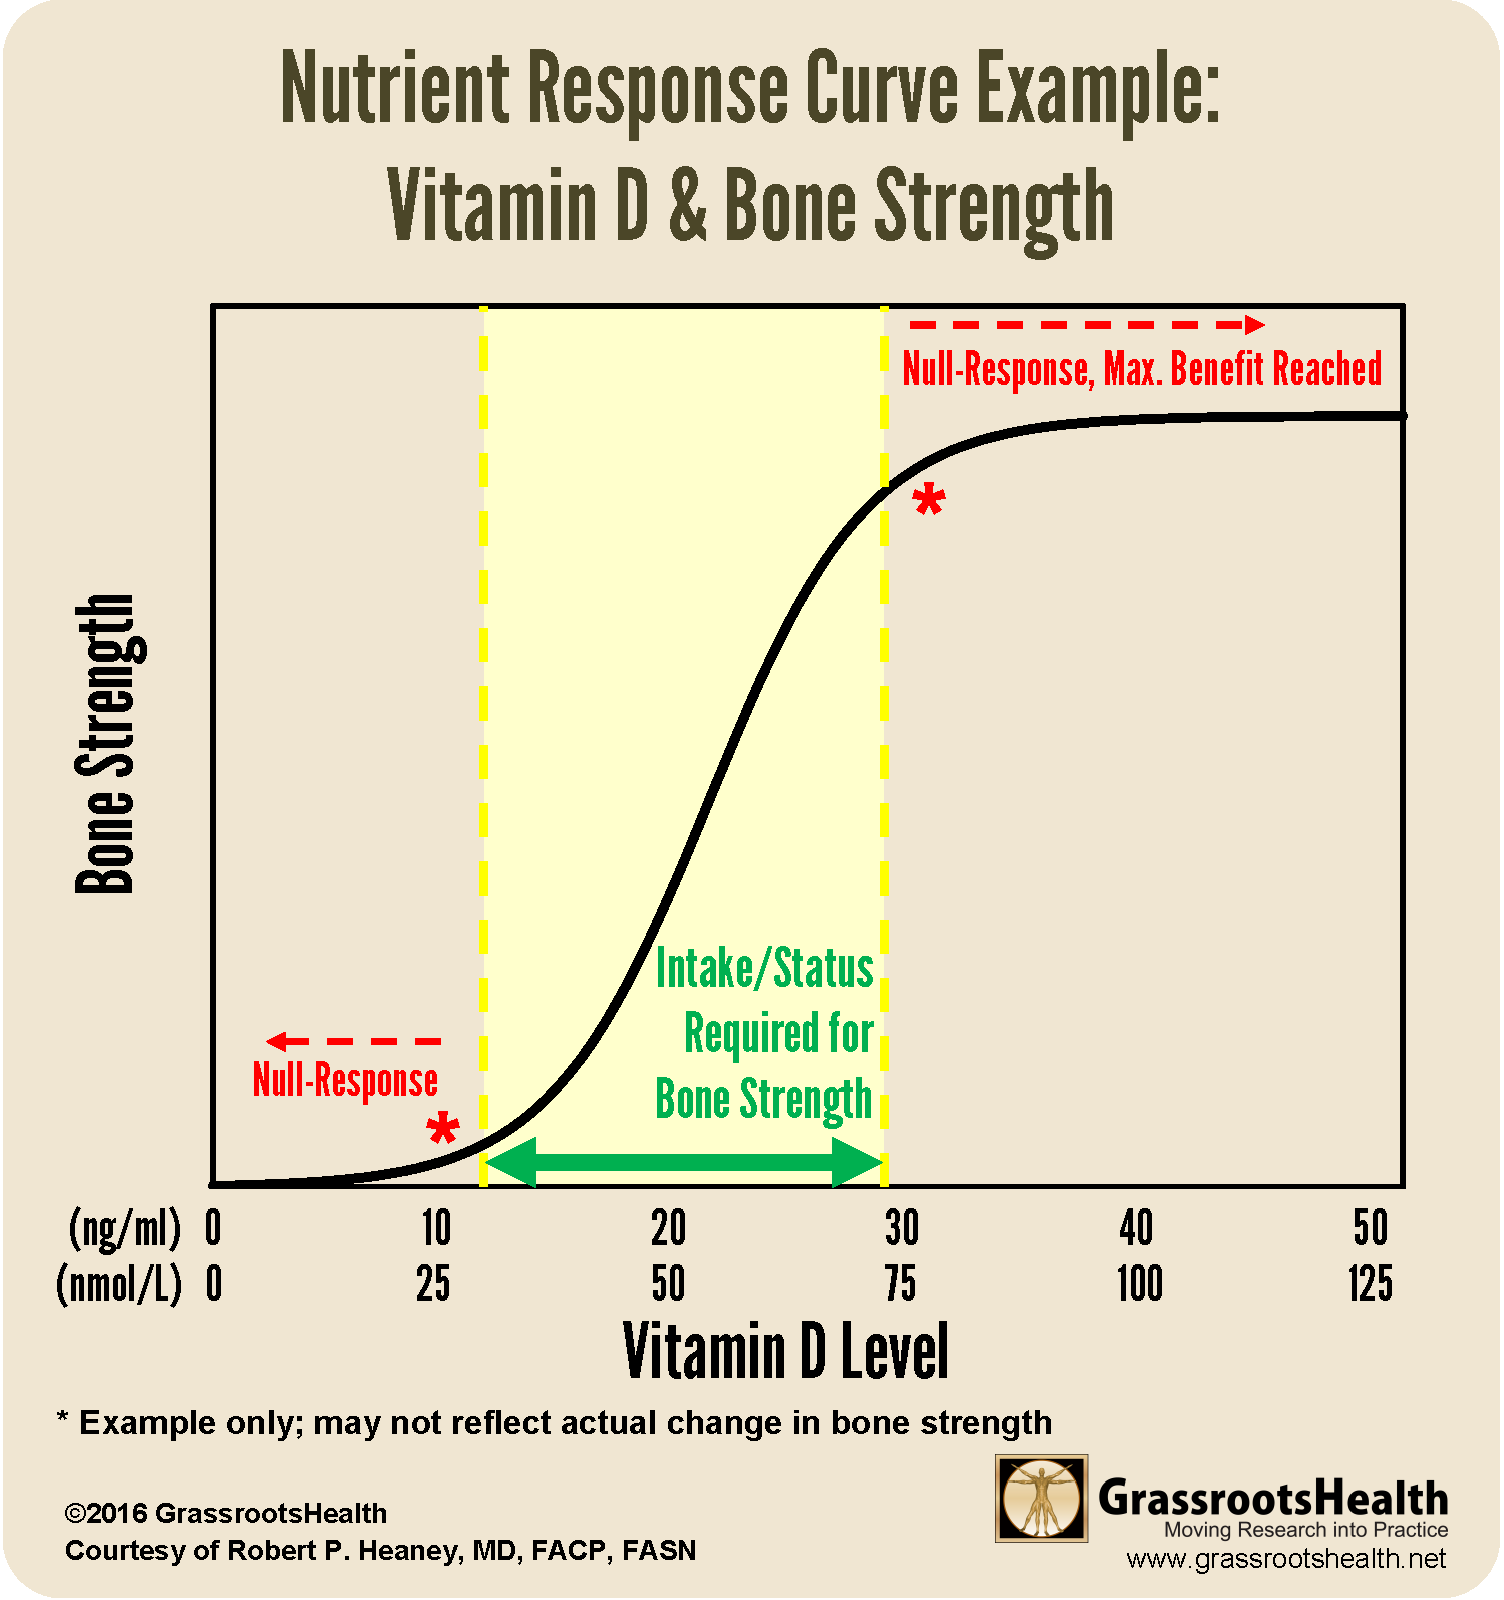
Let’s say bones require a vitamin D level of 30 ng/ml (75 nmol/L) to reach their maximum bone strength. Any change in vitamin D status from below 30 ng/ml up to 30 ng/ml might show added benefit (increased bone strength), however, the amount of benefit seen will depend on the starting vitamin D level. If going from 12 ng/ml or lower up to 30 ng/ml, one would expect to see the greatest increase in bone strength. However, if going from 25 ng/ml up to 30 ng/ml, very minimal benefit will be seen, since most of the benefit had already been achieved at the starting level.
System-Specific Responses
Most nutrients have many different functions within the body, with response curves varying by system (such as skeletal vs immune) and nutrient responses varying with basal (baseline) and achieved nutrient status, dose/intake, and system-specific sensitivity. For example, the skeletal benefits of vitamin D (to prevent rickets) are seen at much lower levels, while cancer prevention benefits are seen at much higher levels.
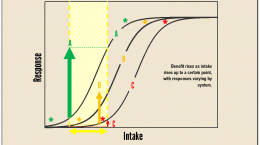
This next chart builds on this concept by illustrating examples of system-specific responses of a given nutrient to a given intake or dose.
Let’s imagine the curves in the chart below represent the need of vitamin D (intake/resulting serum level) to carry out specific functions within the skeletal system (curve A), during pregnancy (curve B), and within the immune system (curve C). The same change in a given intake or serum level will have varying effects in each system, as shown by each curve. When considering a specific intake or change, that same dose/change in level may produce a measurable response in one system (as illustrated by the green arrow with curve ‘A,’ representing bone strength) and a null response in another system (as illustrated by the red arrow with curve ‘C,’ representing the immune response).
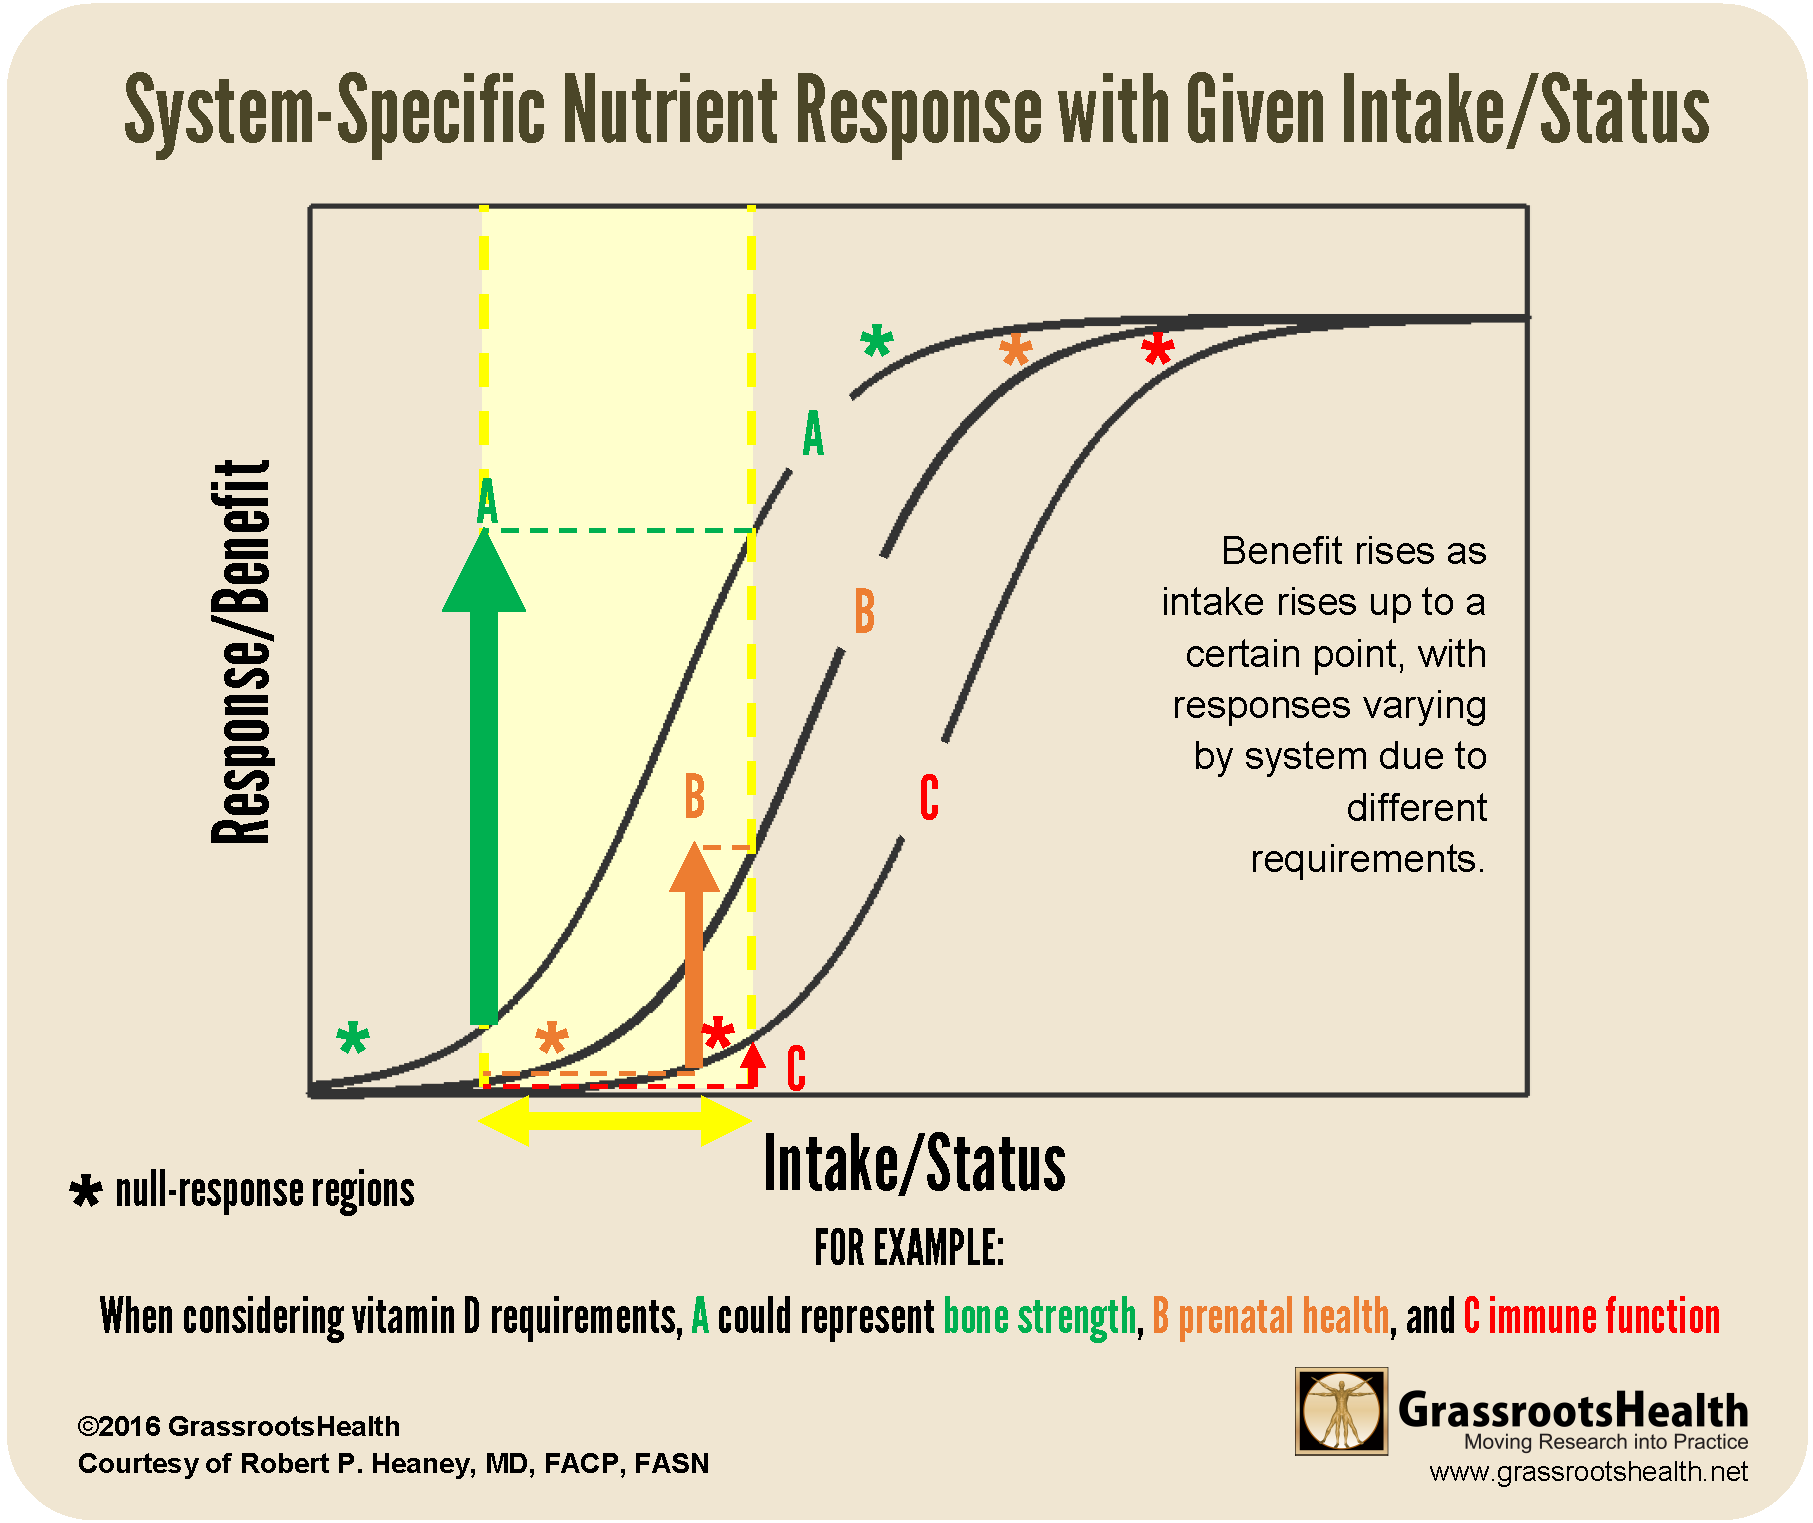
In short, when determining an optimal intake or status for a specific nutrient, it is important to also consider the desired outcome or health benefit.
Demonstrating the Above Through Vitamin D Research
The Disease Incidence Prevention (DIP) Chart was one of the first graphics created by GrassrootsHealth to illustrate this concept for vitamin D. The DIP chart summarizes the percent of disease reduction for specific conditions by achieved vitamin D level, based on data from 15 peer-reviewed, published papers. It uses a reference level of 25 ng/ml, which means that the percentage reductions are based on raising levels from 25 ng/ml to the amount showing the percentage reduction. (25 ng/ml is the average vitamin D level in the US and Canada).
This concept is further described for the top diseases known to be major causes of death, based on a review of the strongest evidence published to date, in a recent paper by Grant et al..
Did the LeBoff Paper Meet the Nutrient Study Criteria #1 and #3 when Analyzing for Bone Fractures?
Now that we have a clear understanding of the concepts above, let’s take a look at a couple of the nutrient study criteria and apply them to the LeBoff paper on fracture risk and vitamin D.
Criteria #1: Basal nutrient status must be measured, used as an inclusion criterion for entry into study, and recorded in the report of the trial.
PARTIALLY MET FOR 16,757 Participants (DID NOT MEET for 9,114 Participants)
Measuring vitamin D levels at the beginning of a study is essential to defining a starting point, telling the researchers how much vitamin D participants are already getting (from supplements as well as sun/UVB and food), and whether they might already be getting enough to fulfill certain needs within the body. Baseline vitamin D status should therefore be an inclusion criterion, with the study enrolling only participants with deficient vitamin D levels, or levels below a known response range for the desired outcome (typically below 20 ng/ml or 50 nmol/L for bone health).
Vitamin D levels were measured at baseline for 16,757 of the 25,871 participants (this part of this criteria was therefore only met for some of the participants). However, for those who did have a baseline vitamin D level, it was not used as part of the study inclusion criteria (criteria not met). As stated in the study abstract, “Participants were not recruited on the basis of vitamin D deficiency, low bone mass, or osteoporosis.” In fact, the average baseline vitamin D level for the participants who did have a baseline vitamin D level, including those in the placebo group, was 31 ng/ml – which is already considered sufficient for bone health (see the Zhu et al. study, which found a 39% lower risk of hip fracture and a 30% lower risk of fracture-related hospitalization for participants with vitamin D levels of at least 30 ng/ml versus below 20 ng/ml).
Criteria #3: The change in nutrient status produced in those enrolled in the trials must be measured and recorded in the report of the trial.
PARTIALLY MET FOR 2,655 Participants (DID NOT MEET for 23,216 Participants)
While baseline vitamin D level was measured for some of the participants, follow-up levels were only measured for 2,655 participants. This makes determining a change in nutrient status (and meeting Criteria #4 – covered in Part 3) impossible for a majority of the participants in the study.
Did the LeBoff Paper Meet the Remaining 3 Criteria?
Continue on to our 3rd post in this 3-part series!
Vitamin D is an Easily Modifiable Factor to Help Improve Disease Outcomes – What Vitamin D Level do YOU Have?
Don’t ever consider a situation too late to take steps for correcting or avoiding vitamin D deficiency. Measuring your vitamin D level and calculating a supplementation amount to help reach and maintain a target level, or taking loading doses to correct deficiency faster, could possibly make all the difference in how a current disease situation progresses. Test your level now!
Create your custom home blood spot kit by adding any of the following measurements, along with your vitamin D:
- Omega-3 Index (with or without Ratios)
- Magnesium (with or without additional Elements – copper, zinc, selenium, mercury, cadmium, lead)
- hsCRP as a marker of inflammation and HbA1c as a marker of blood sugar health, two other important factors influencing prenatal conditions
Having and maintaining healthy vitamin D levels and other nutrient levels can help improve your health and the health of your baby, now and for the future. Enroll and test your levels today, learn what steps to take to improve your status of vitamin D (see below) and other nutrients and blood markers, and take action! By enrolling in the GrassrootsHealth projects, you are not only contributing valuable information to everyone, you are also gaining knowledge about how you could improve your own health through measuring and tracking your nutrient status, and educating yourself on how to improve it.
How Can You Use this Information for YOUR Health?
Having and maintaining healthy vitamin D and other nutrient levels can help improve your health now and for your future. Measuring is the only way to make sure you are getting enough!
STEP 1 Order your at-home blood spot test kit to measure vitamin D and other nutrients of concern to you, such as omega-3s, magnesium, essential and toxic elements (zinc, copper, selenium, lead, cadmium, mercury); include hsCRP as a marker of inflammation or HbA1c for blood sugar health
STEP 2 Answer the online questionnaire as part of the GrassrootsHealth study
STEP 3 Using our educational materials and tools (such as our dose calculators), assess your results to determine if you are in your desired target range or if actions should be taken to get there
STEP 4 After 3-6 months of implementing your changes, re-test to see if you have achieved your target level(s)