Published on February 11, 2019

There was a song that was on a 78 record that I had as a child, The Churkendoose (yes, I’m really that old..)
Well It depends upon, begins and ends upon,
It depends on how you look at things!
How nutrient trial design affects results and outcome
The vitamin D research community is literally ‘shooting itself in the foot’ by reporting trial results solely on dosage groups without also always showing the serum level analyses. The dose/response variation as shown in our research and that of others shows a very large variation, a factor of six in terms of response. One person can take 2000 IU/day and get to 20 ng/ml (50 nmol/L), another can take exactly the same amount, 2000 IU/day, and get to 120 ng/ml (300 nmol/L).
If, for example I had two people taking 2000 IU/day and one got to 20 ng/ml, the other to 120 ng/ml, I’d tell you the average was 70 ng/ml.
If we had another group taking 4000 IU/day and both got to 70 ng/ml, I’d tell you the average was 70 ng/ml.
We’d then say that there was ‘no difference’ in the two doses. Really? And, we’d expect no significant difference in the health outcomes?
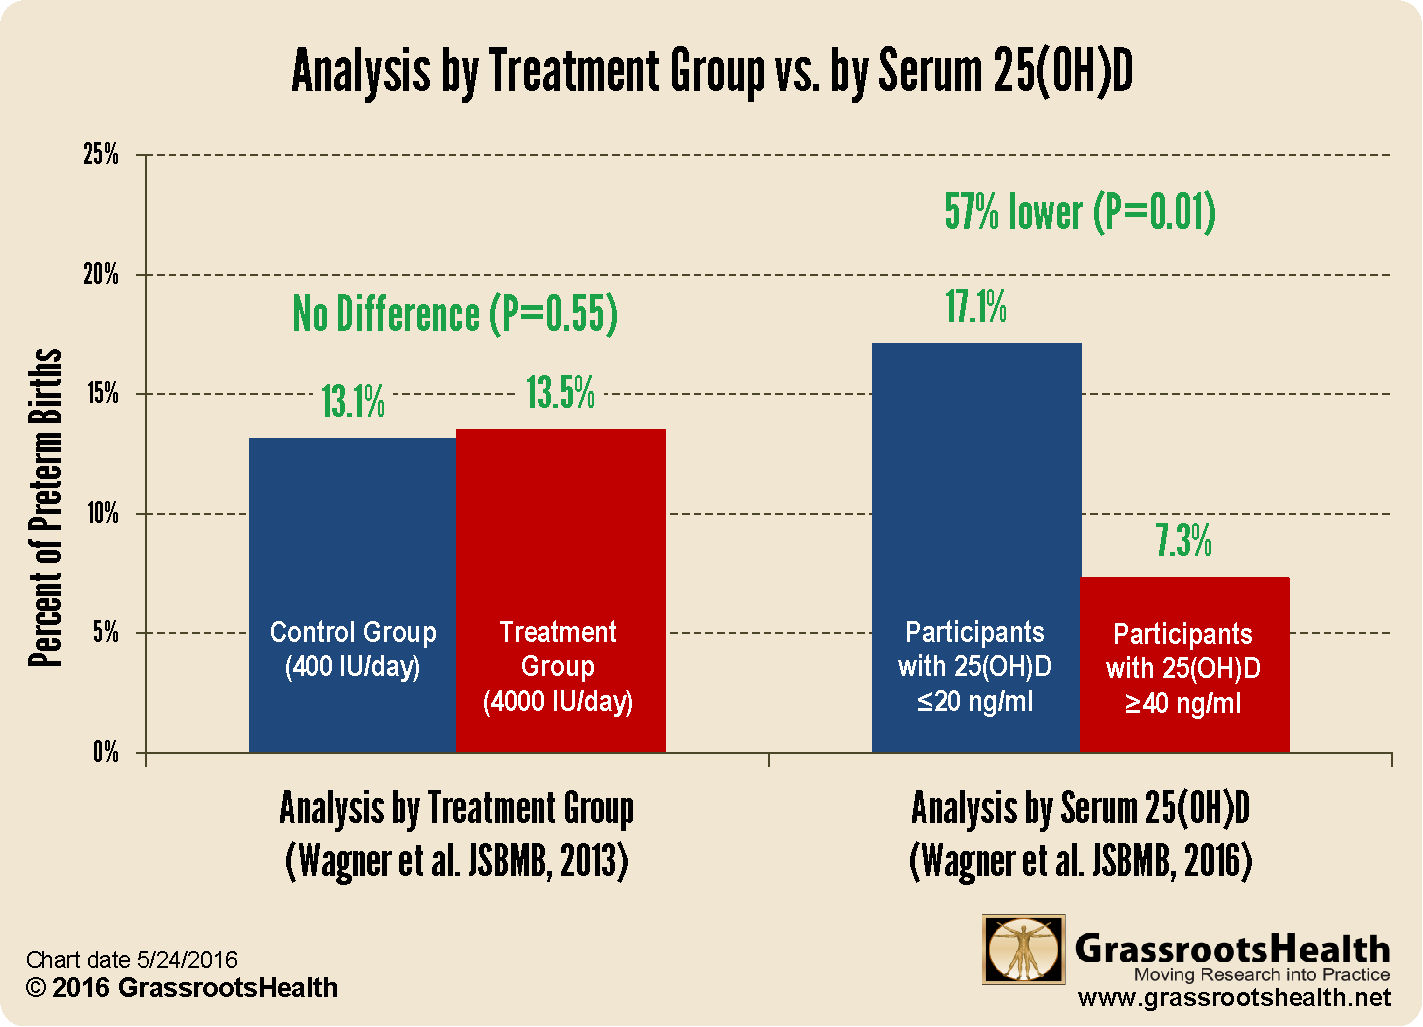
Please look at the chart below to see how that scenario looks with the Hollis/Wagner pregnancy study (left hand side of the chart shows results by intake).

An almost ‘flat’ health outcome chart when looked at by intake level.When we look at the same patients by serum level vs intake, there is a very large difference.

Onwards!
Carole Baggerly, Director
GrassrootsHealth
How can I track my vitamin D level and health?
To help you track your nutrient levels and health outcomes, GrassrootsHealth has created an online tracking system called myData-myAnswers. You can track details about your supplement use and nutrient levels. You can also track many pre-set health conditions, such as cognitive function, or add your own custom trackers. This will help you discover how your nutrient levels impact your health. Check it out today!


