Published on December 21, 2020

Studies and Statistics Part 4: Cohort Studies
 There are many different types of nutrient research studies, including randomized controlled trials (covered in a recent post), cohort studies, case-control studies, and cross-sectional studies. In this blog series we have been exploring key concepts including study types and statistics to help you better understand research results. In previous posts we discussed how the amount of disease is measured within a population and dove into study significance and the p-value. In this post we will focus on study types, specifically cohort studies.
What is a cohort study?
A cohort study is where a group of people, or cohort, is followed prospectively over time and collects information about risk factors or exposures, such as nutrient intake, and outcomes, such as a cancer diagnosis. There is no specific intervention or treatment introduced, such as in a randomized controlled trial (RCT). Remember, the primary analysis from an RCT is intent-to-treat (ITT), to assess the effect of a treatment or protocol on the proportion who develop a disease, according to if they were in a treatment group or a control group.
On the other hand, a cohort study looks at a single large population over time to determine the difference in a particular outcome based on certain variables shared within that group. Analyses of cohort studies seek to determine the association between a particular exposure (something people are doing, eating or being exposed to as part of their daily lives), and an outcome (such as developing cancer), while adjusting for other risk factors that could bias the results (such as age or BMI). However, there still could be unknown or unmeasured risk factors could influence the results. Since exposures and outcomes are collected in chronological order, cohort studies, like RCTs, can distinguish between cause and effect.
Showing the Data – Kaplan Meier Curves
The Kaplan-Meier curve is a visual representation of events over time, such as those occurring throughout a cohort study. The curve shows what the probability of an event (for example, survival or being diagnosed with a disease) is at a certain time interval. For example, we may follow a cohort over time to find out if an exposure such as smoking influences whether they are diagnosed with cancer, or whether a treatment reduced the number of deaths from a heart attack in comparison with controls.
If the sample size is large enough, the curve should approach the “true” survival for the population under investigation. It is usually used to compare two or more groups in a study (such as in a cohort study comparing whether they had a certain exposure compared to those who did not, or in a RCT the group that got treatment A vs a group that got placebo).
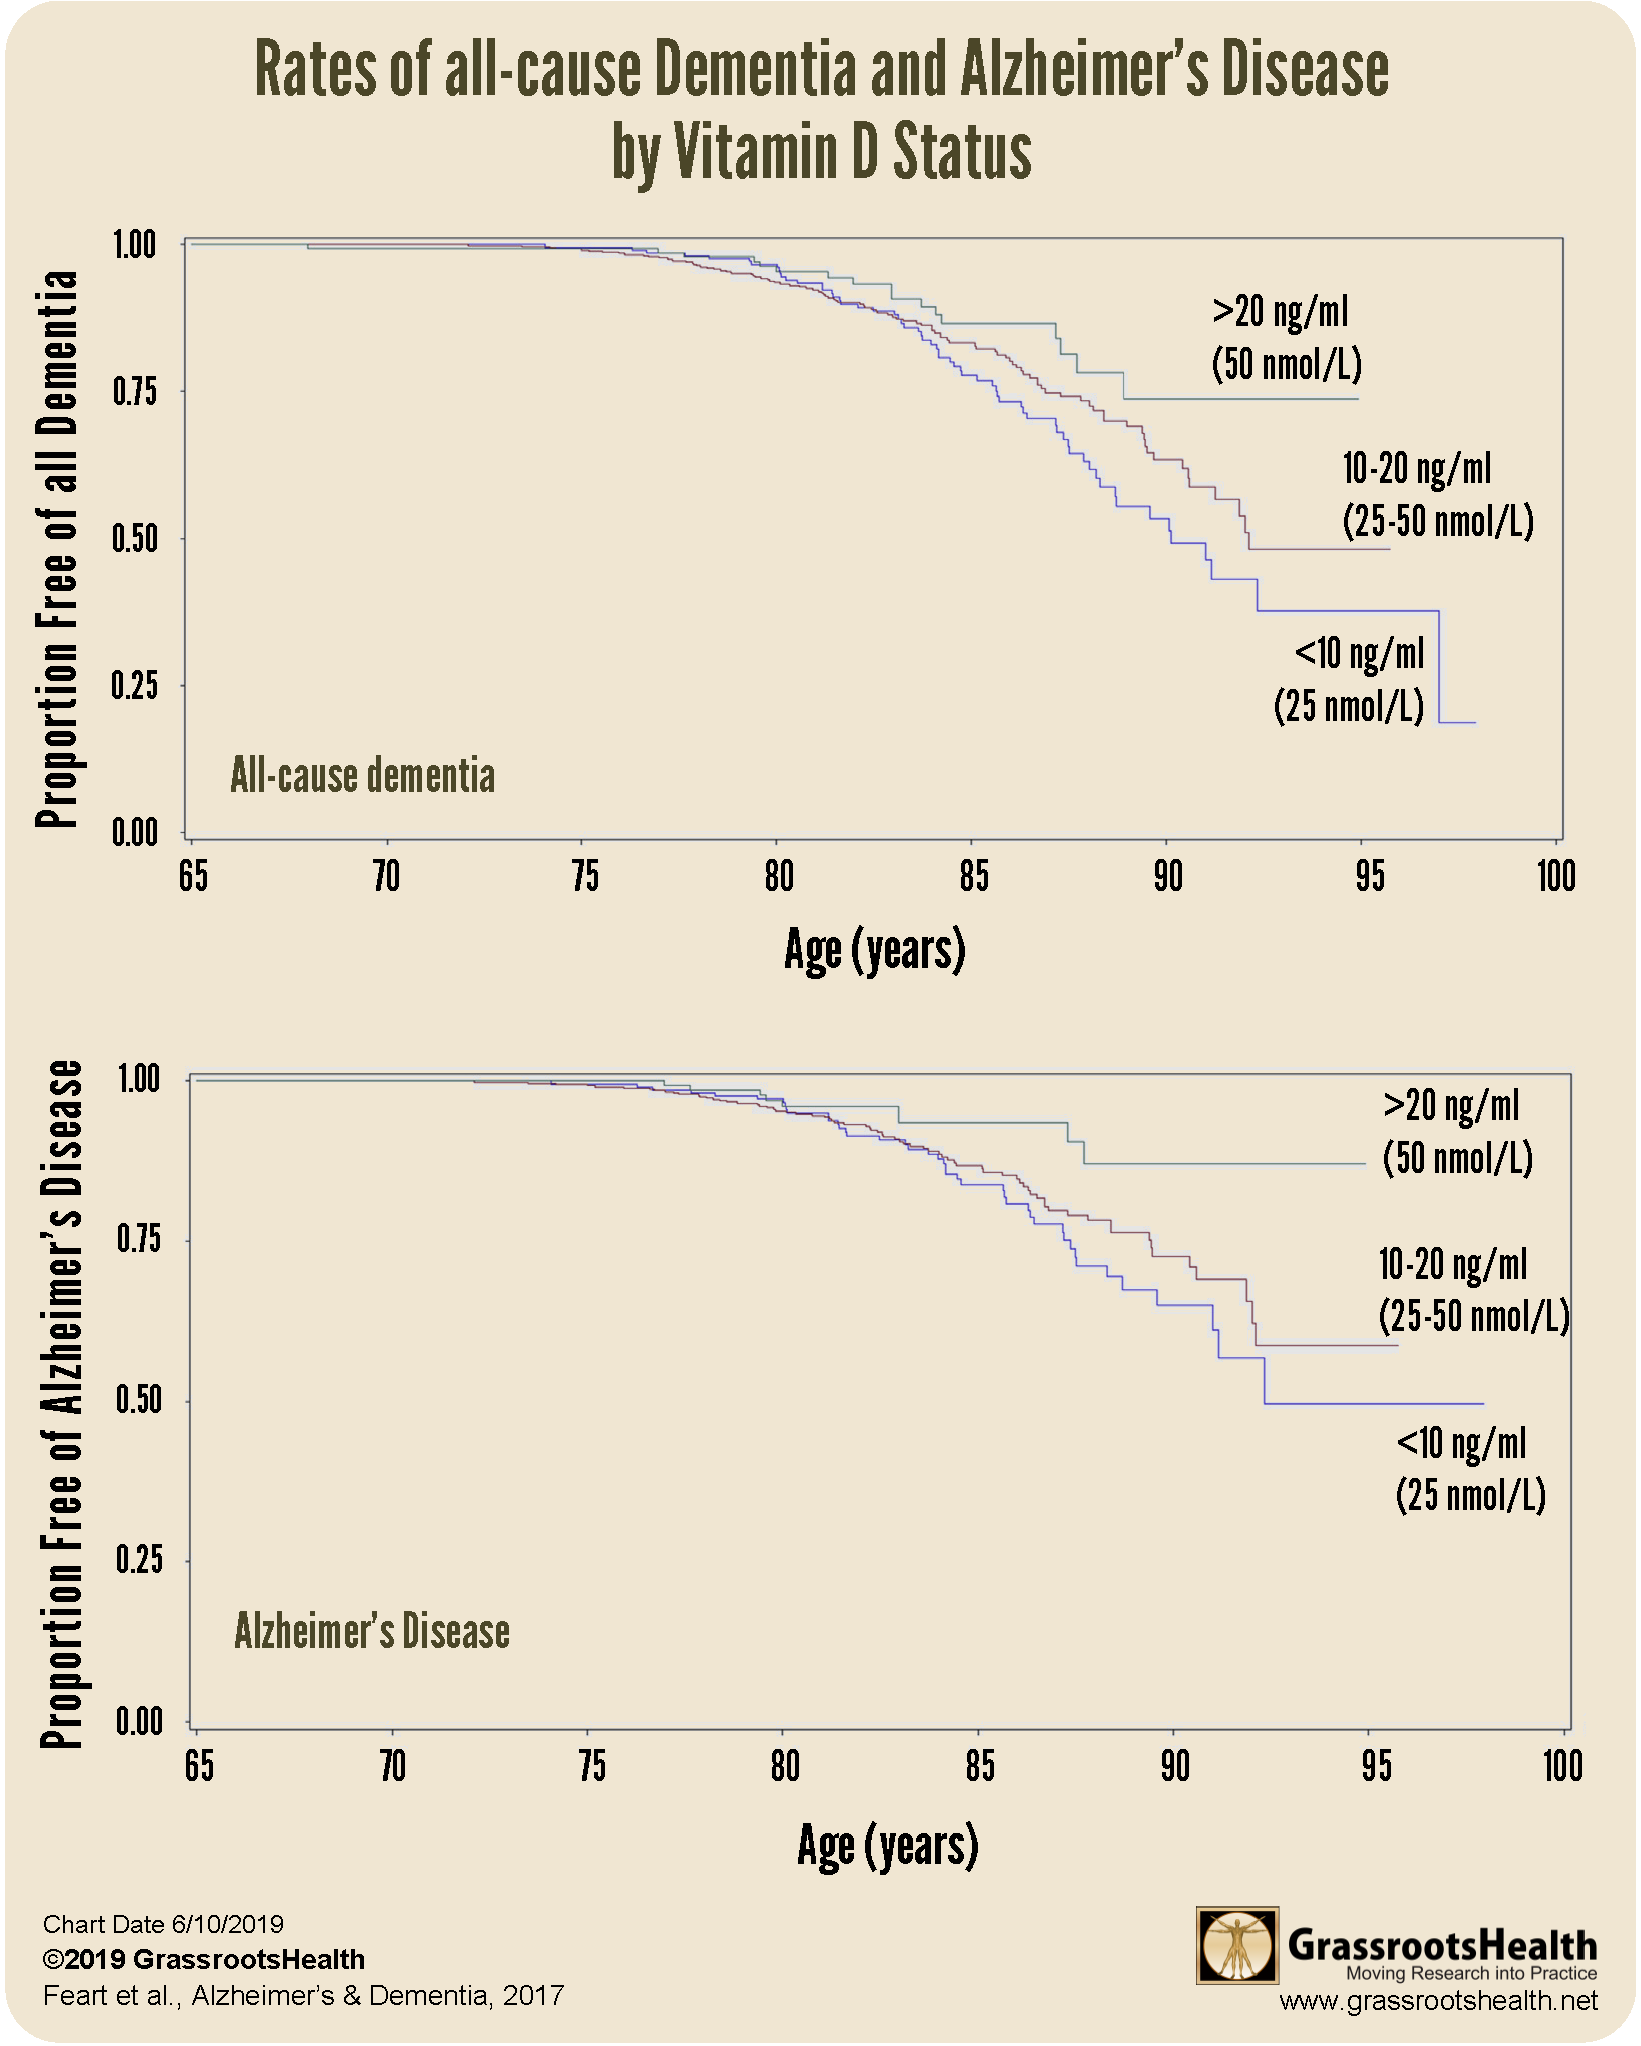
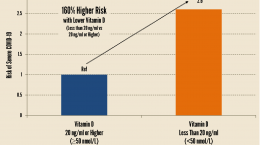
The Kaplan-Meier curves above illustrate the rates of incidence of dementia and Alzheimer’s Disease risk by vitamin D levels for a population consisting of 916 participants, aged 65 and older, whose measurements for vitamin D status and cognitive decline were tracked over 12 years. A total of 177 cases of dementia were validated, of which 124 were confirmed Alzheimer’s disease. The lines on the charts represent the percent of participants who remained disease free (were not diagnosed with dementia or Alzheimer’s Disease) – as you can see, those with higher vitamin D levels (greater than 20 ng/ml or 50 nmol/L) were more likely to remain free of dementia and Alzheimer’s compared to participants with lower vitamin D levels (10-20 ng/ml and less than 10 ng/ml or 25 nmol/L). The risk of disease also went up as vitamin D level declined.
What is the GrassrootsHealth study?
The GrassrootsHealth approach is similar to a cohort study, but unlike other studies it focuses on participant education and involvement. Armed with information about nutrients and their test results, participants can take ownership over their own health. Further, GrassrootsHealth focuses on physiological measures of nutrient status, such as vitamin D levels, which captures the effect of multiple input sources (e.g. food, supplements, sun) and makes provision for the variability in dose-response between individuals unlike analyses of dose amounts.
For example, GrassrootsHealth has compared the amounts of colds and flus that participants report based on their intakes of vitamin C and D and their Omega-3 index.
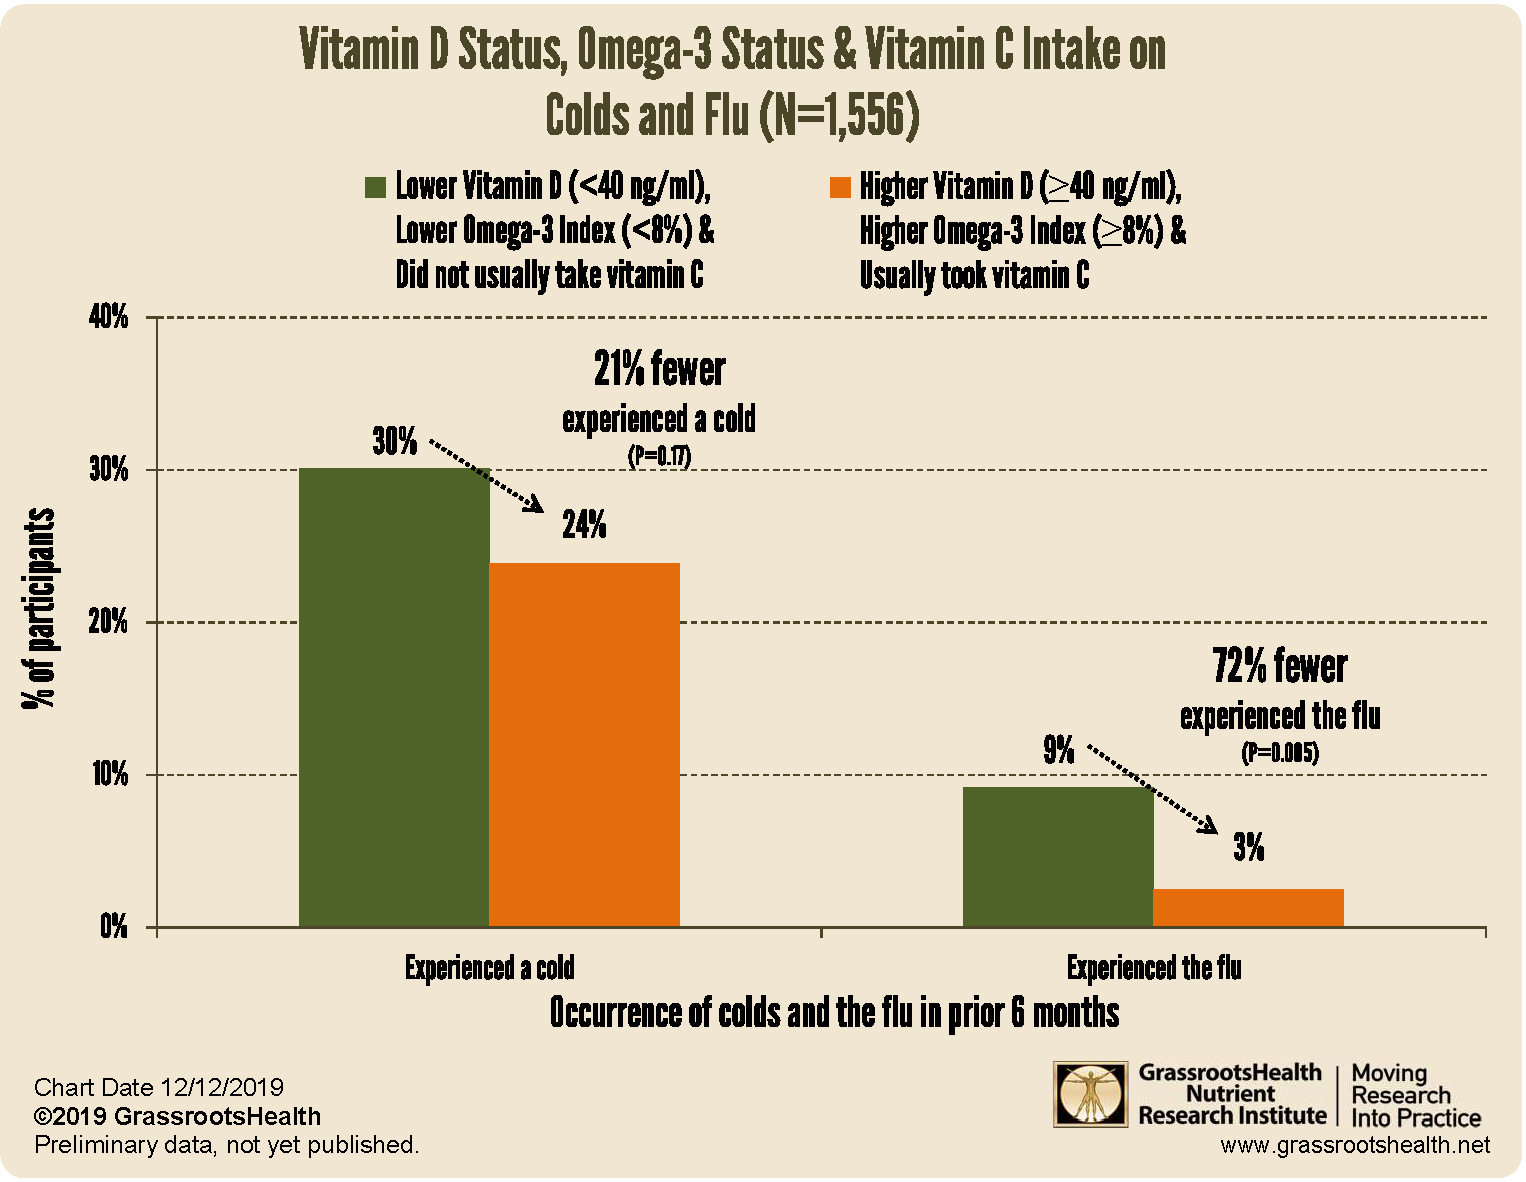
We found that the percent of participants who experienced the flu in the prior 6 months was 72% lower for those with a vitamin D level at or above 40 ng/ml who also had an Omega-3 Index at or above 8% and also reported that they usually took supplemental vitamin C compared to those with a vitamin D level less than 40 ng/ml and an Omega-3 Index below 8% who did not report usually taking supplemental vitamin C (P=0.005). For colds, it was 21% lower (P=0.17).
Take Charge of Your Own Health!
By joining the GrassrootsHealth projects, you are not only contributing valuable information to our study, but you are also gaining knowledge about how you could improve your own health through measuring and tracking your nutrient status, and educating yourself on how to improve it. Do you know what your status of vitamin D, omega-3s, and other essential nutrients is? Could your levels be improved? Test now to find out!
What does the Research Say about Vitamin D & COVID-19?
It’s TIME to start saving lives! If you can help PREVENT the majority of the death, it’s time! What’s it costing you/us not to take action NOW?
There is much published research that supports a clear link between vitamin D and COVID-19 showing that higher vitamin D levels are related to:
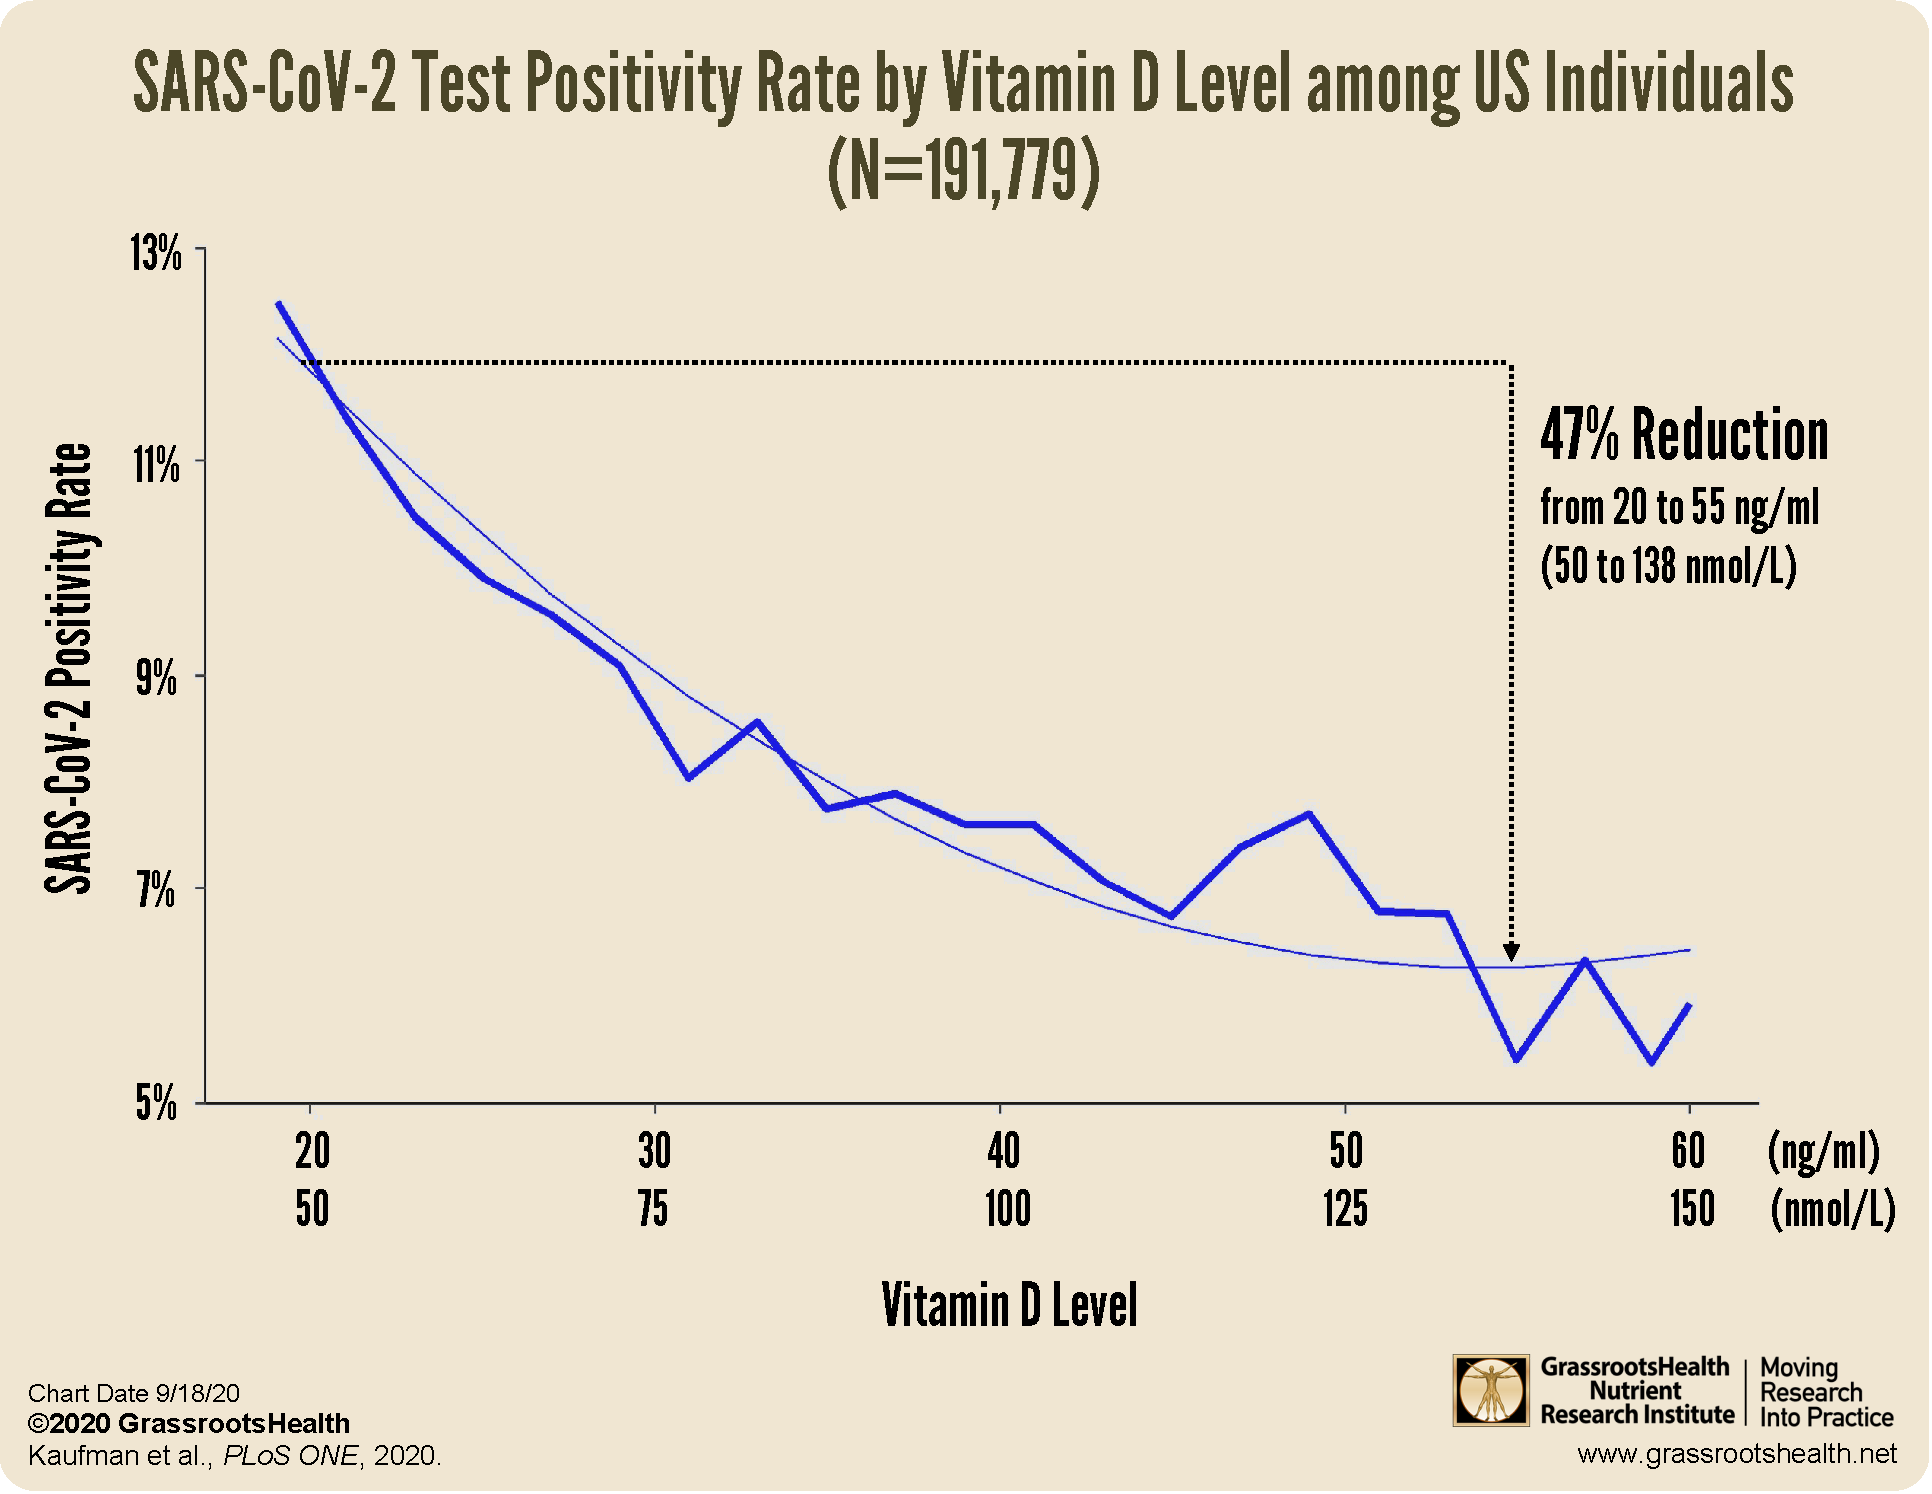
a decreased risk of testing positive for COVID-19
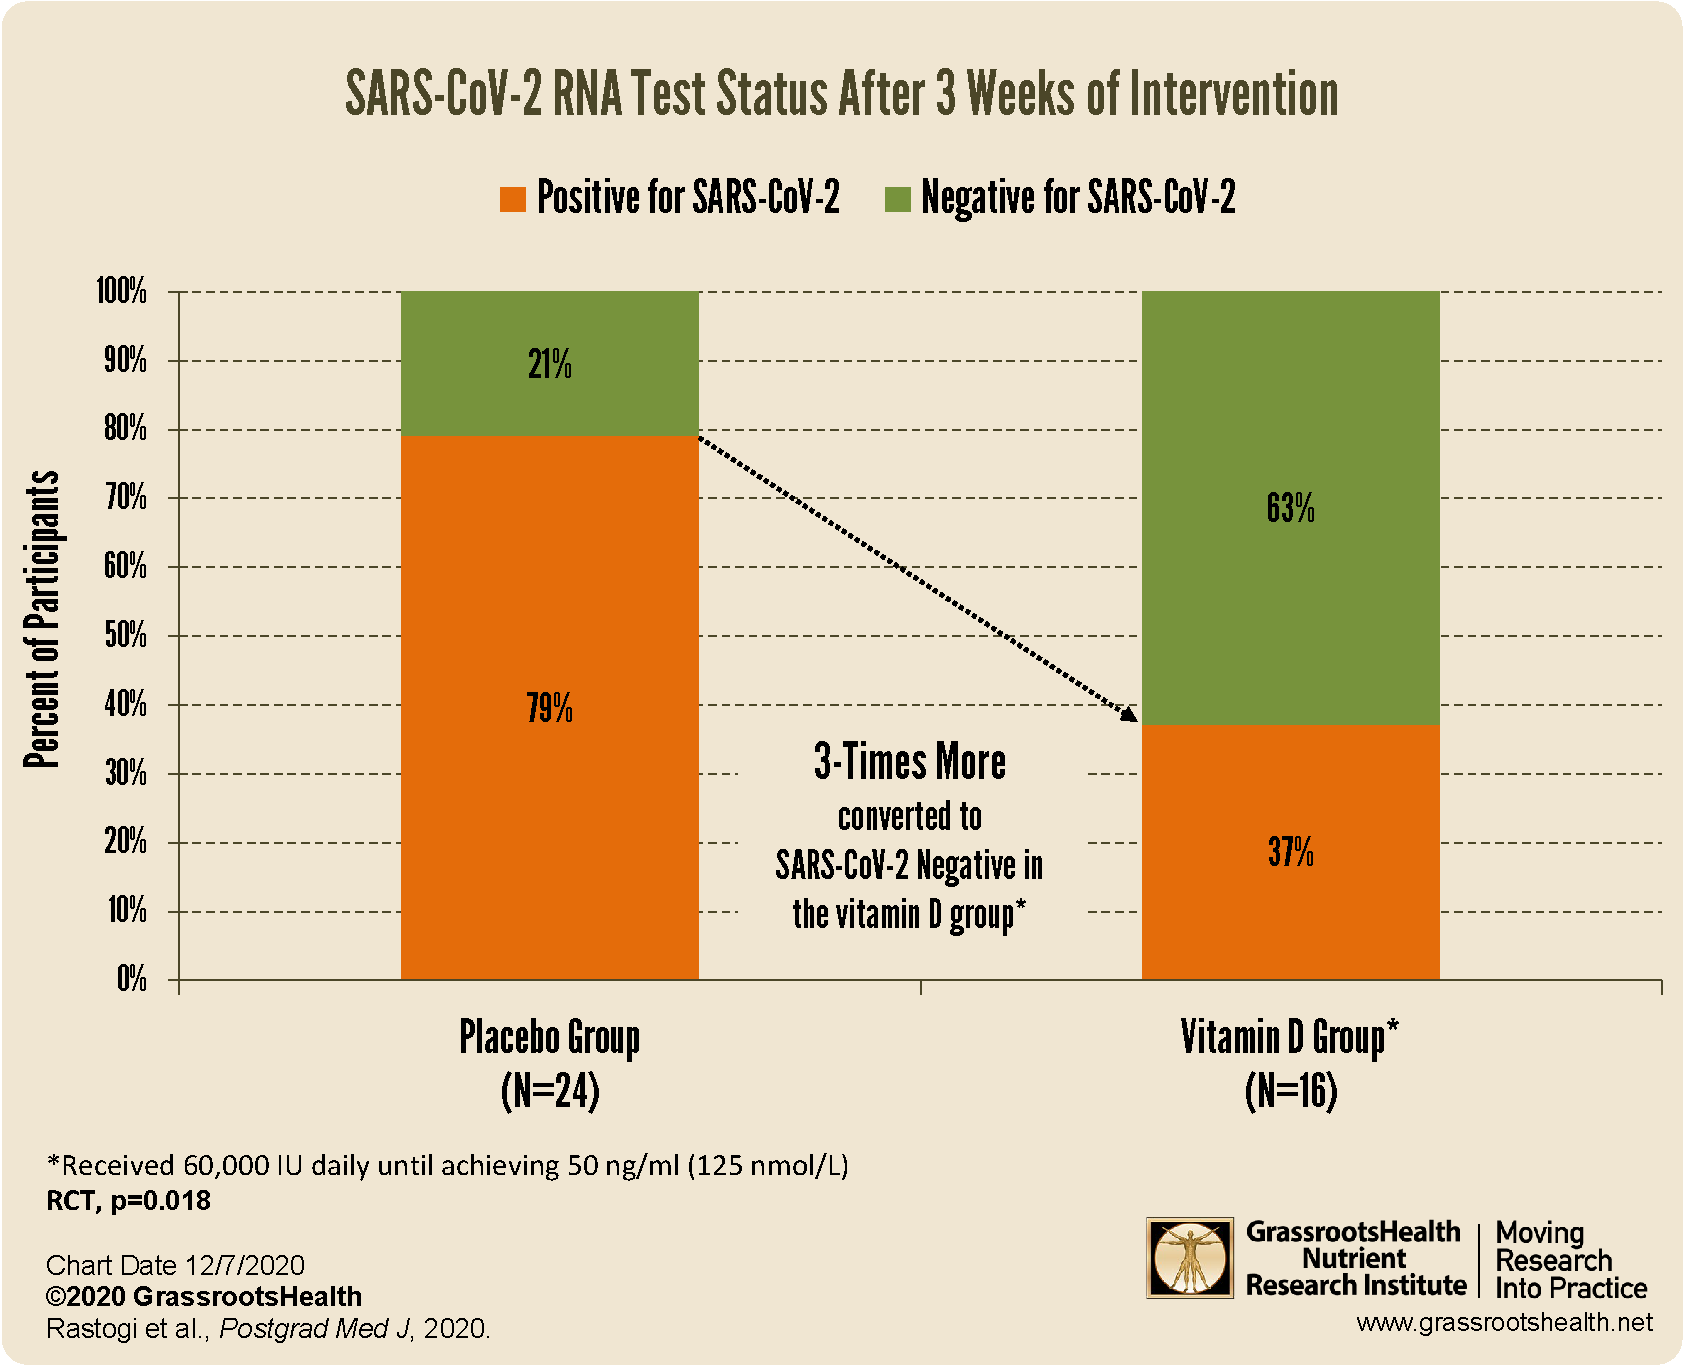 increased viral SARS-CoV-2 RNA clearance
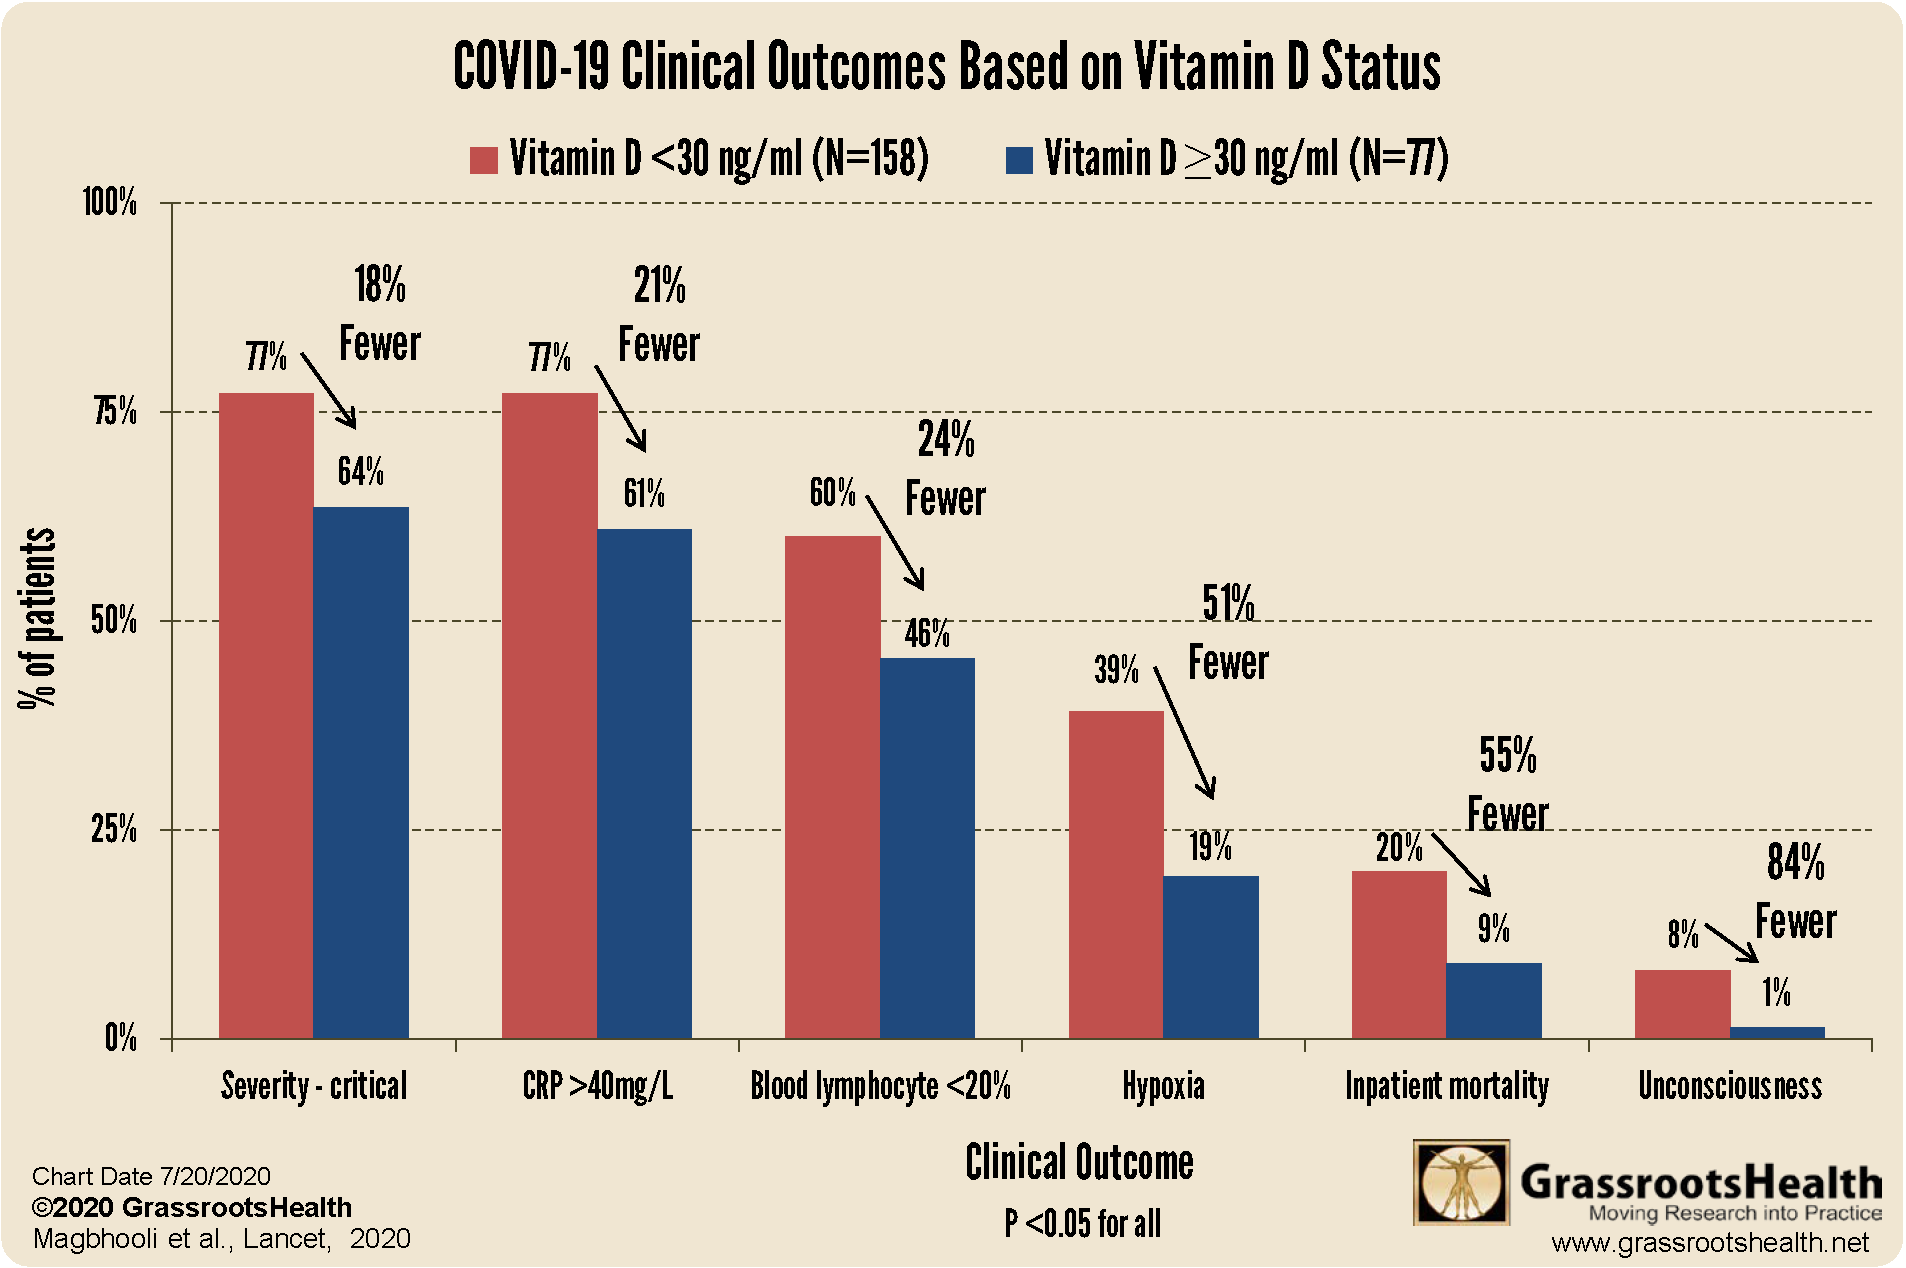
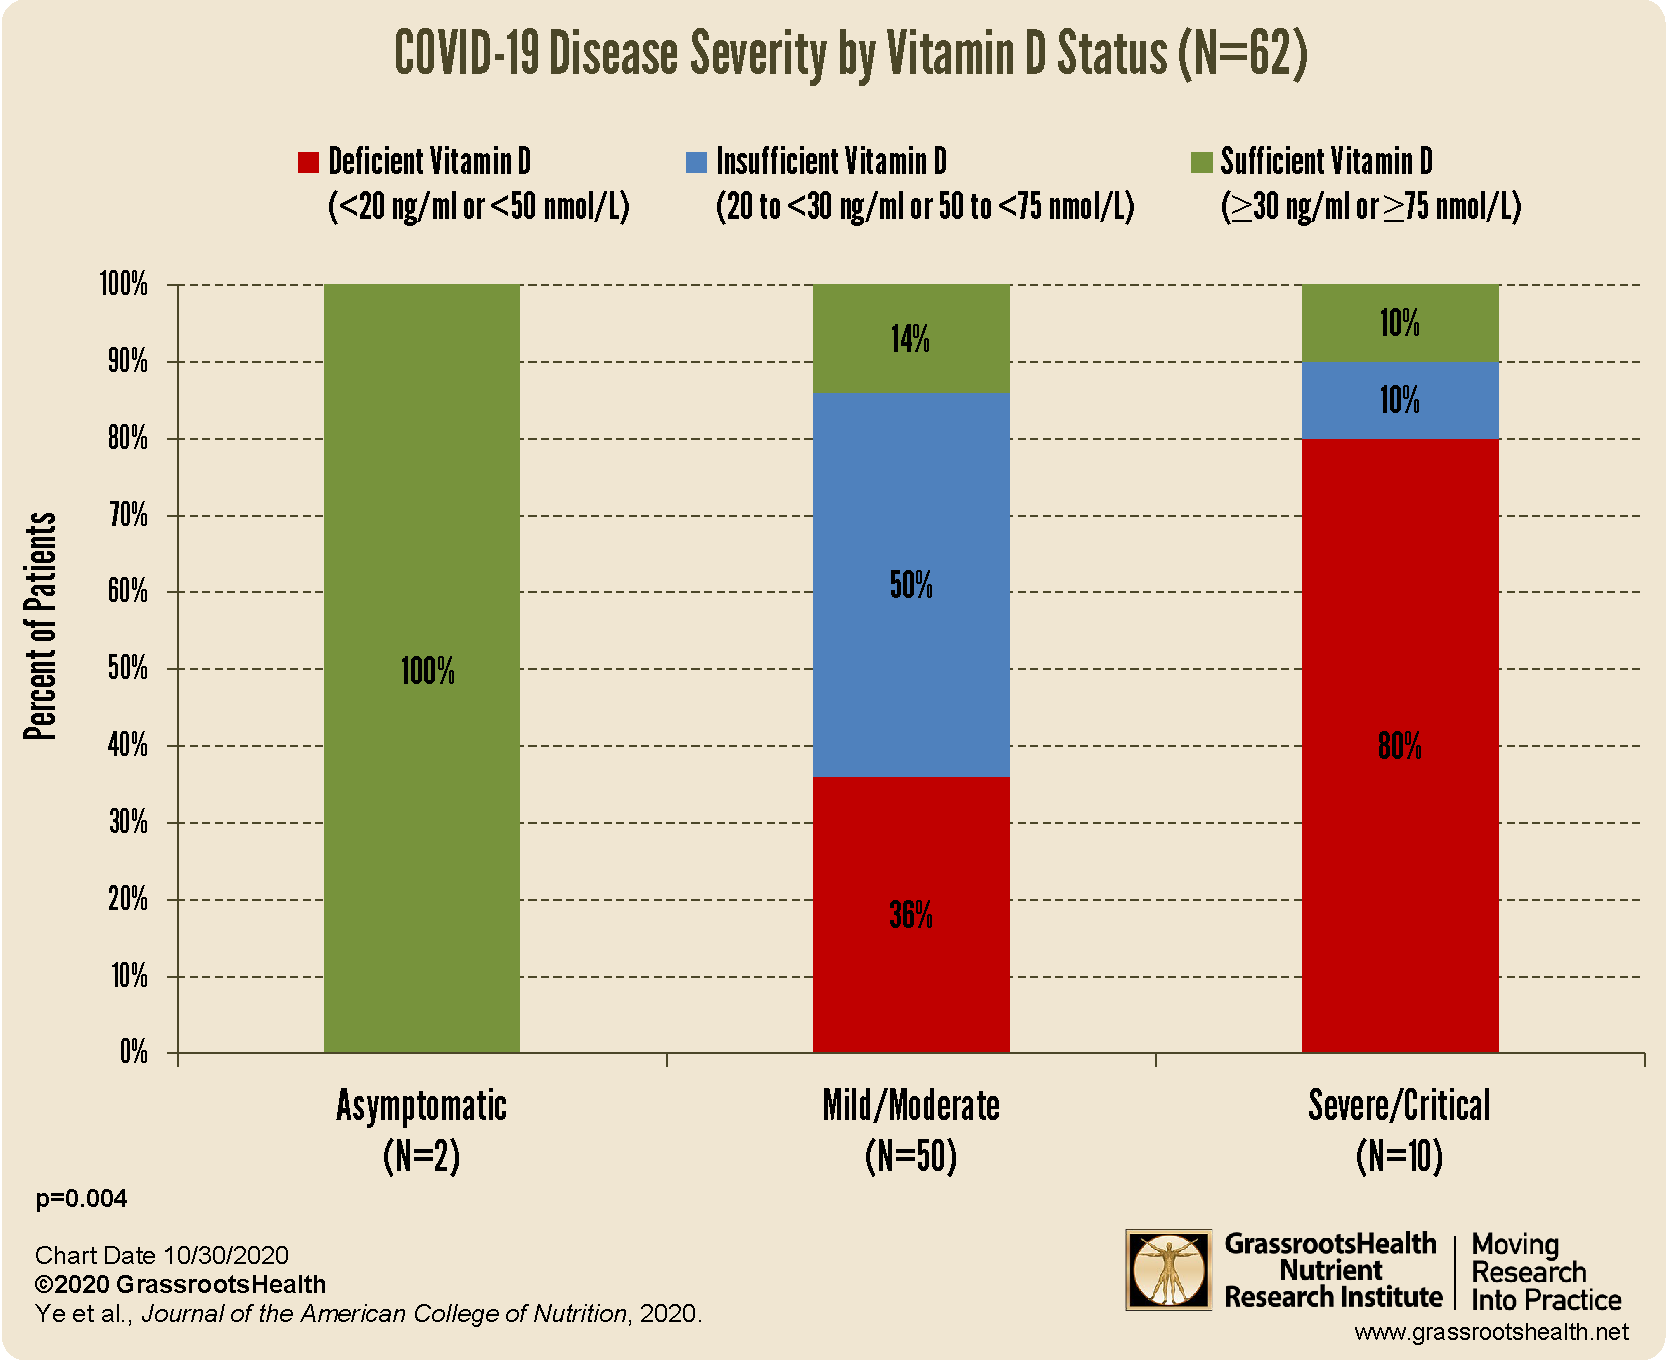
better clinical outcomes among patients with COVID-19
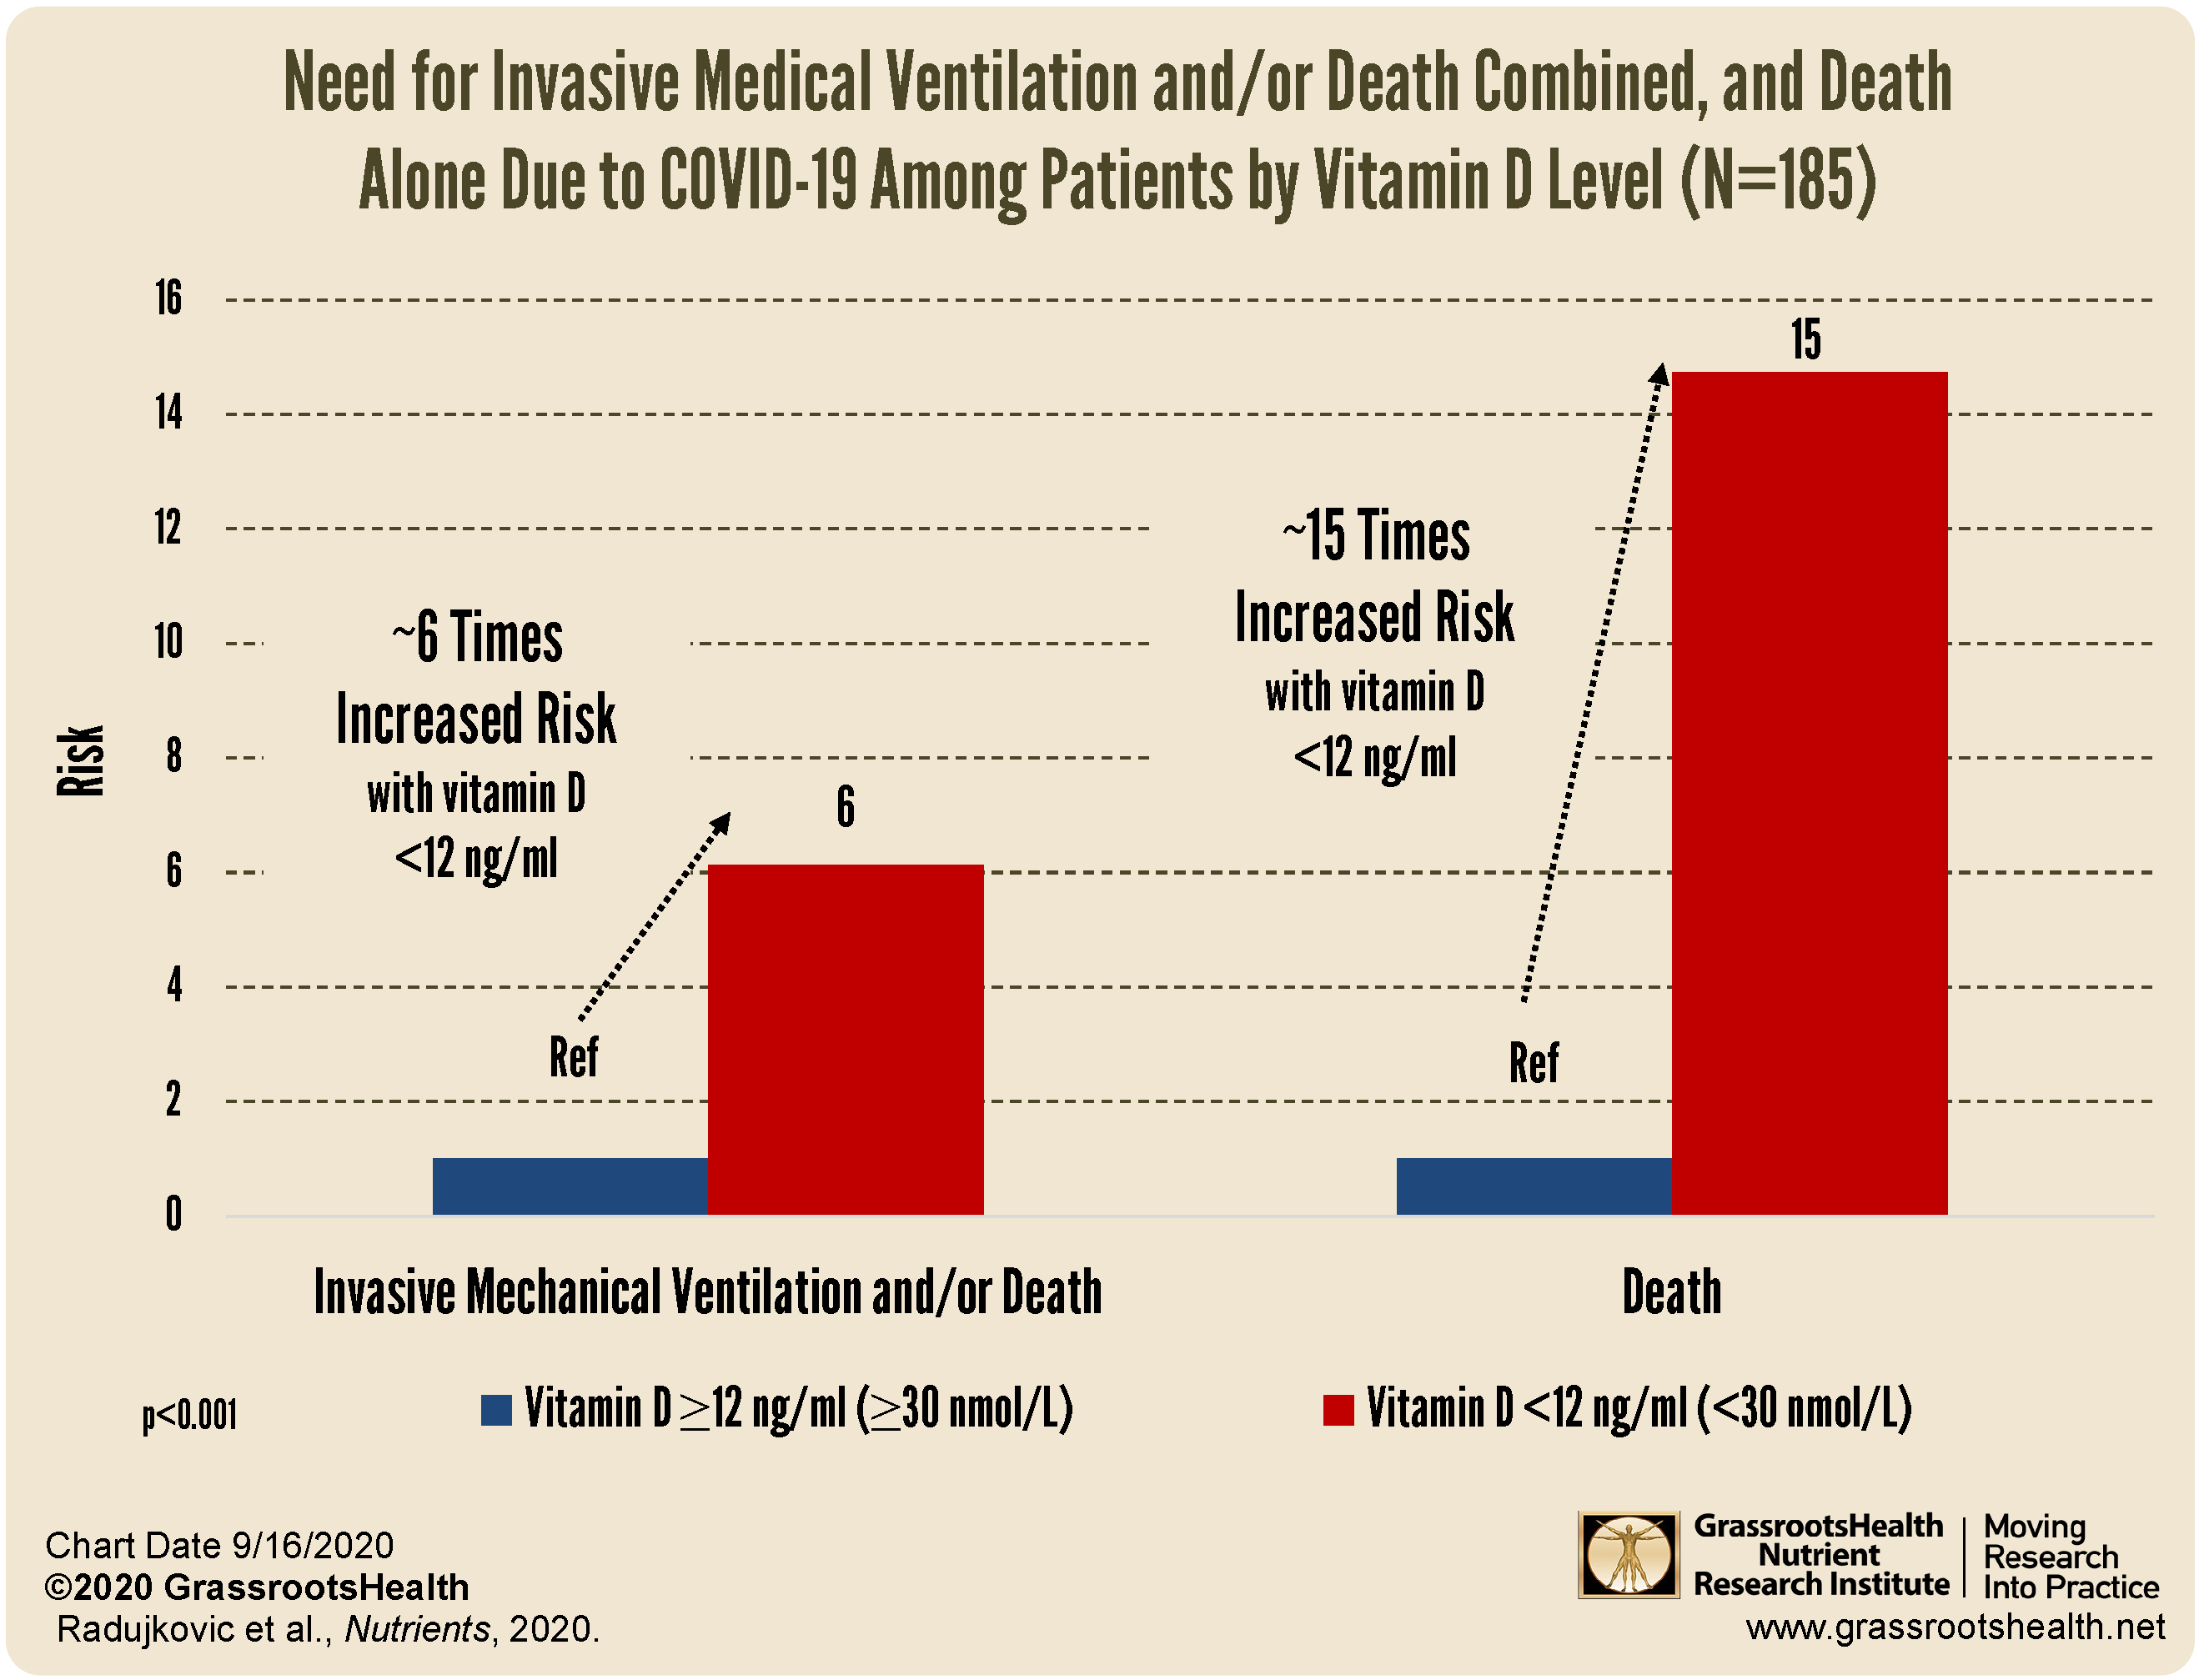
decreased risk of death due to COVID-19
Be sure to educate yourself on the benefits and importance of vitamin D for immune health, and take steps to ensure you and your loved ones are getting enough.
You can review all of the COVID-19 and immune health information we have shared on this page.
How Can You Use this Information for YOUR Health?

Having and maintaining healthy vitamin D and other nutrient levels can help improve your health now and for your future. Measuring is the only way to make sure you are getting enough!
STEP 1 Order your at-home blood spot test kit to measure vitamin D and other nutrients of concern to you, such as omega-3s, magnesium, essential and toxic elements (zinc, copper, selenium, lead, cadmium, mercury); include hsCRP as a marker of inflammation or HbA1c for blood sugar health
STEP 2 Answer the online questionnaire as part of the GrassrootsHealth study
STEP 3 Using our educational materials and tools (such as our dose calculators), assess your results to determine if you are in your desired target range or if actions should be taken to get there
STEP 4 After 3-6 months of implementing your changes, re-test to see if you have achieved your target level(s)