Published on July 19, 2019

 Almost 1500 participants have provided information about their cholesterol since the questions were added to the D*action questionnaire in April of 2017. In our last post about cholesterol, we presented information about how many participants knew what their cholesterol and triglyceride levels were. Today, we will cover what those cholesterol levels looked like among the participants who shared their results. Later on in this series, we will present additional information on triglycerides, along with some important facts about cholesterol, your health, and other nutrients involved.
What should the target cholesterol level be?
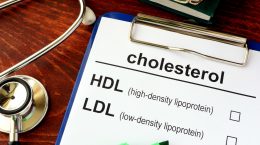
With most blood tests measuring cholesterol, values for total cholesterol, low-density lipoproteins (LDL), and high-density lipoproteins (HDL) are provided as part of the results. The National Cholesterol Education Program recommends a desirable range for total cholesterol of less than 200 mg/dL (or 5.2 nmol/L); anything above 240 mg/dL (6.2 nmol/L) is considered high, while anything between 200 – 240 mg/dL is borderline high. A desirable range for LDL is below 130 mg/dL (3.4 nmol/L) and a desirable range for HDL is above 50 mg/dL (1.3 nmol/L).
How to interpret cholesterol results for health
It is important to know how much of the total cholesterol is LDL (the “bad” cholesterol) compared to how much is HDL (the “good” cholesterol). One useful way to look at this is with the “cholesterol ratio.” This ratio of total cholesterol to HDL can be a better indicator of heart health than each of the results alone and is sometimes included in an overall cholesterol report. To calculate this ratio on your own, simply divide the total cholesterol result by the HDL result. For example, if your total cholesterol is 200 mg/dL and your HDL is 50 mg/dL, dividing 200 by 50 would give you a ratio of 4 to 1. A ratio of 3.5 to 1 is considered very good, and a ratio of 5 to 1 is considered acceptable to most health authorities. The higher the ratio of total cholesterol to HDL, the higher the risk of atherosclerosis and heart disease.
What were the cholesterol levels of GrassrootsHealth participants?
The following are results for those participants who have reported their cholesterol levels.
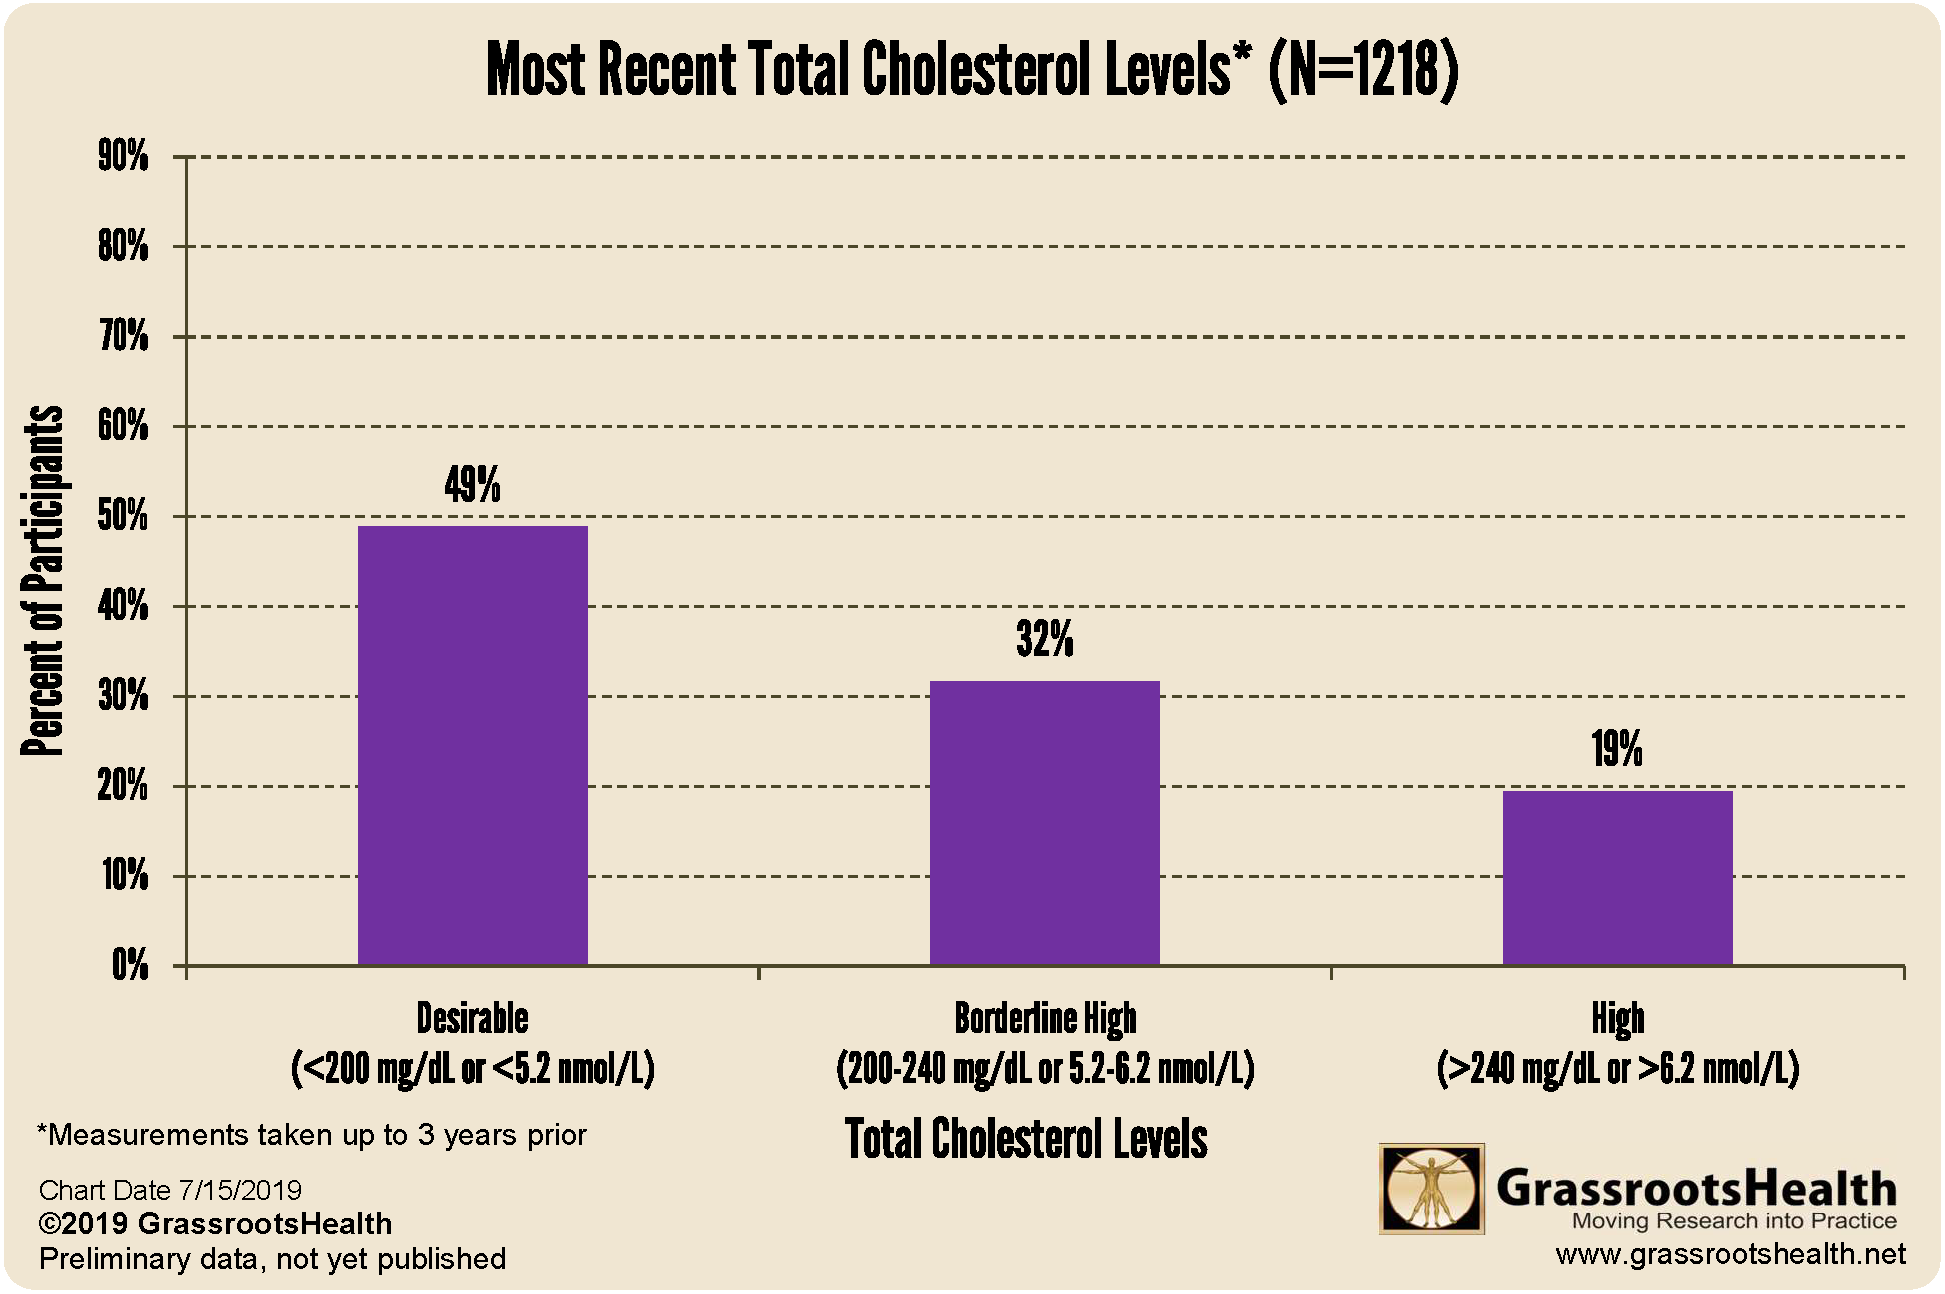
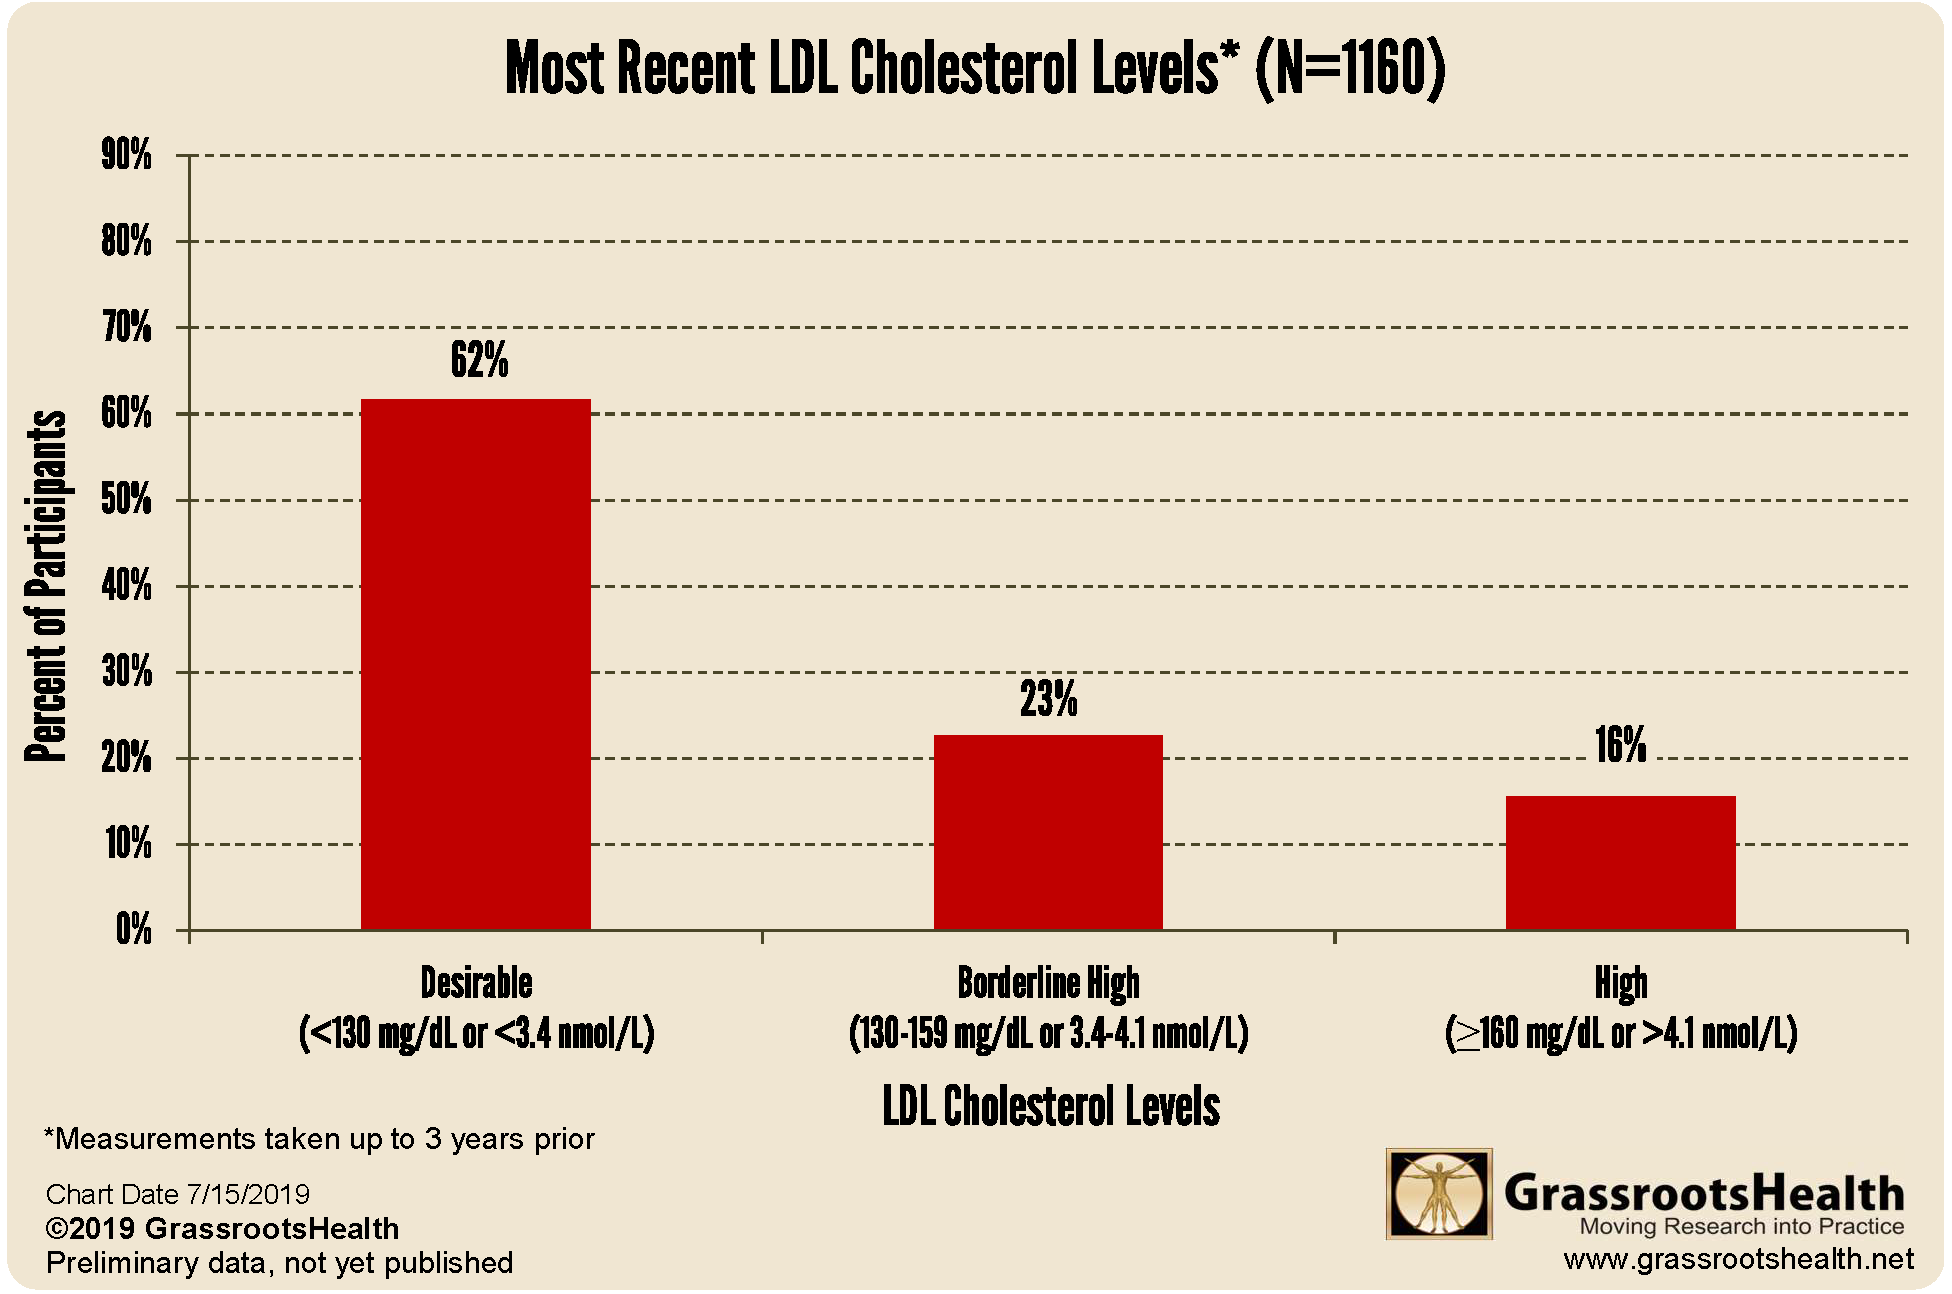
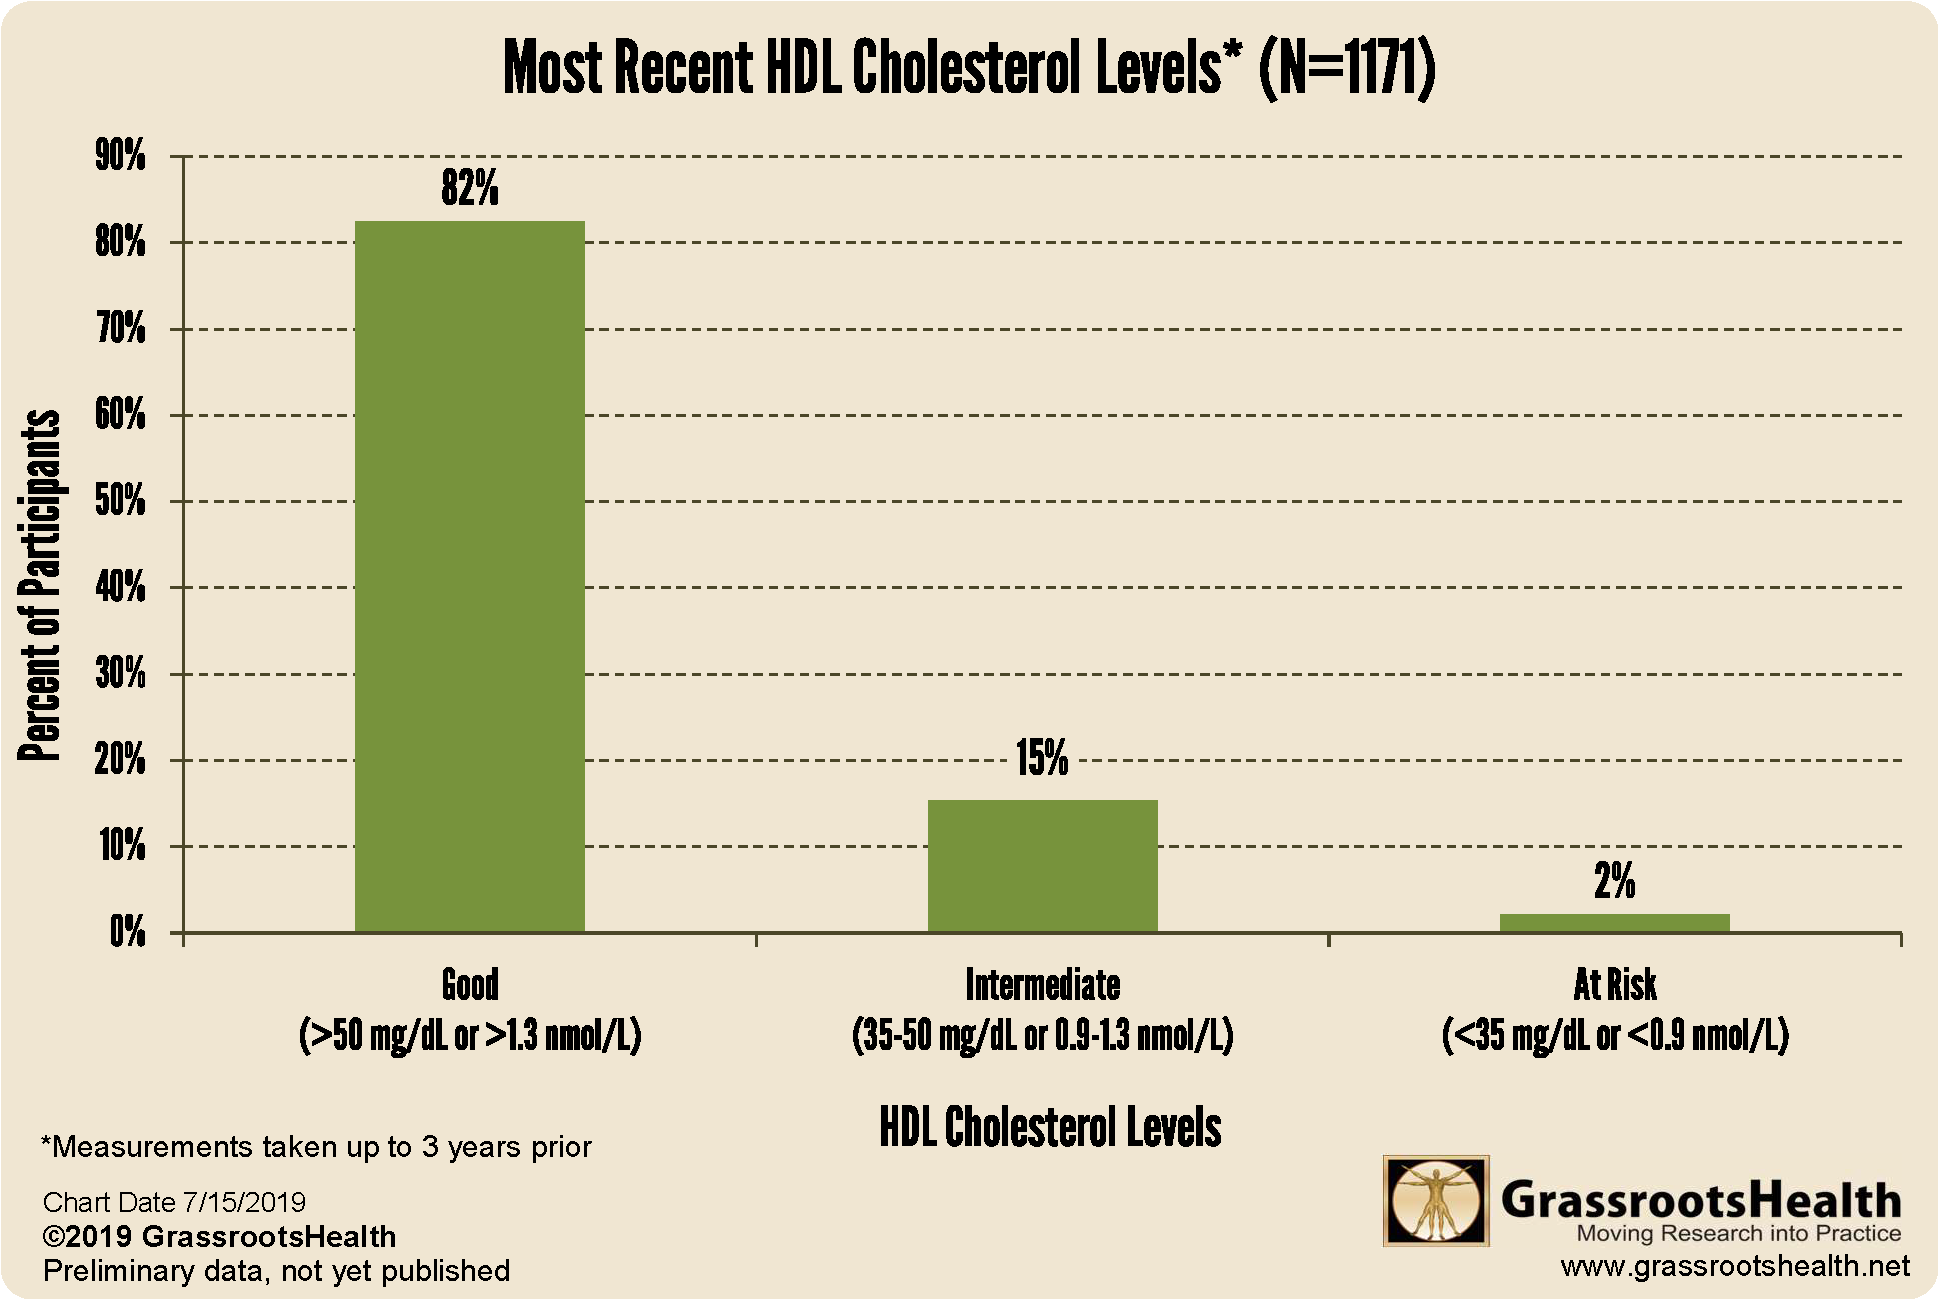
In looking at the above charts, you can see that while nearly half of the participants had high or borderline-high total cholesterol, 82% of the participants also had high HDL and may have had desirable cholesterol ratios.
Stay tuned for more information on the cholesterol and triglyceride levels reported by participants, followed by if and how certain nutrients might affect or be affected by cholesterol and triglycerides.
Have questions you would like to see addressed?
If there is a topic you would like us to address, please let us know! Send your news-worthy questions to jen @grassrootshealth.org and let us know what you think we should answer or share in our news.
Do you know your vitamin D level?
Make sure you and your loved ones know your level of vitamin D! Testing vitamin D levels and taking daily steps to keep it at a target level of 40-60 ng/ml (100-150 nmol/L) is important for all stages of health. Find out your levels today! Log on to the shop (click the link below) to get your tests and see for yourself if your levels can be improved.
Make sure you track your results before and after, about every 6 months!

Click Here to Access the Shop Page
How can I track my vitamin D levels?
To help you track your nutrient levels, GrassrootsHealth has created an online tracking system called myData-myAnswers. You can also track your vitamin D intake from supplements, dietary and UV sources. Check it out today!
How Can You Use this Information for YOUR Health?
Having and maintaining healthy vitamin D and other nutrient levels can help improve your health now and for your future. Measuring is the only way to make sure you are getting enough!
STEP 1 Order your at-home blood spot test kit to measure vitamin D and other nutrients of concern to you, such as omega-3s, magnesium, essential and toxic elements (zinc, copper, selenium, lead, cadmium, mercury); include hsCRP as a marker of inflammation or HbA1c for blood sugar health
STEP 2 Answer the online questionnaire as part of the GrassrootsHealth study
STEP 3 Using our educational materials and tools (such as our dose calculators), assess your results to determine if you are in your desired target range or if actions should be taken to get there
STEP 4 After 3-6 months of implementing your changes, re-test to see if you have achieved your target level(s)