Published on July 28, 2020

 Chronic, low-level inflammation has been linked to a number of chronic diseases including cardiovascular disease and diabetes. The higher the inflammation levels, the higher the risk of developing chronic disease. Sometimes an individual will experience symptoms such as joint pain or fatigue, but often times there will be no symptoms until disease occurs. Therefore, the only way to know what your inflammation levels are is to measure them.
GrassrootsHealth offers two tests that provide information about your levels of inflammation: C-reactive Protein (CRP) Test and AA:EPA Ratio Test, both part of the Inflammation Panel Test Kit. In a previous blog we showed the CRP levels among GrassrootsHealth participants. In today’s blog we will look at the AA:EPA ratio.
What is the AA:EPA Ratio?
The AA:EPA ratio is a measure of the primary pro/anti-inflammatory omegas (arachidonic acid and eicosapentaenoic acid). AA is an omega-6 fatty acid that promotes inflammation which can lead to the development of chronic disease. Linoleic acid, which is found in cooking oils and processed foods, is a precursor to AA; however, AA is mostly determined by your body’s metabolism rather than your diet. EPA is an omega-3 fatty acid found in seafood (primarily fatty fish) and most marine-based omega-3 supplements that can reduce inflammation. As part of either the Inflammation Panel or as an add-on to our Omega-3 Index test, you can find out your AA:EPA Ratio. Generally, a lower ratio showing a close balance is better for health; however, the optimal range for health has not been established. Some experts consider the desirable range for the AA to EPA ratio to be 2.5 to 11; others consider a range of 1.5 to 3 to be low risk, 3 to 6 to be moderate risk, 7-15 to be elevated risk, and above 15 to be high risk. Knowing your ratios can help you take more specific steps to achieve an ideal ratio, mainly by increasing intake of EPA.
What are the AA:EPA levels among GrassrootsHealth Participants?
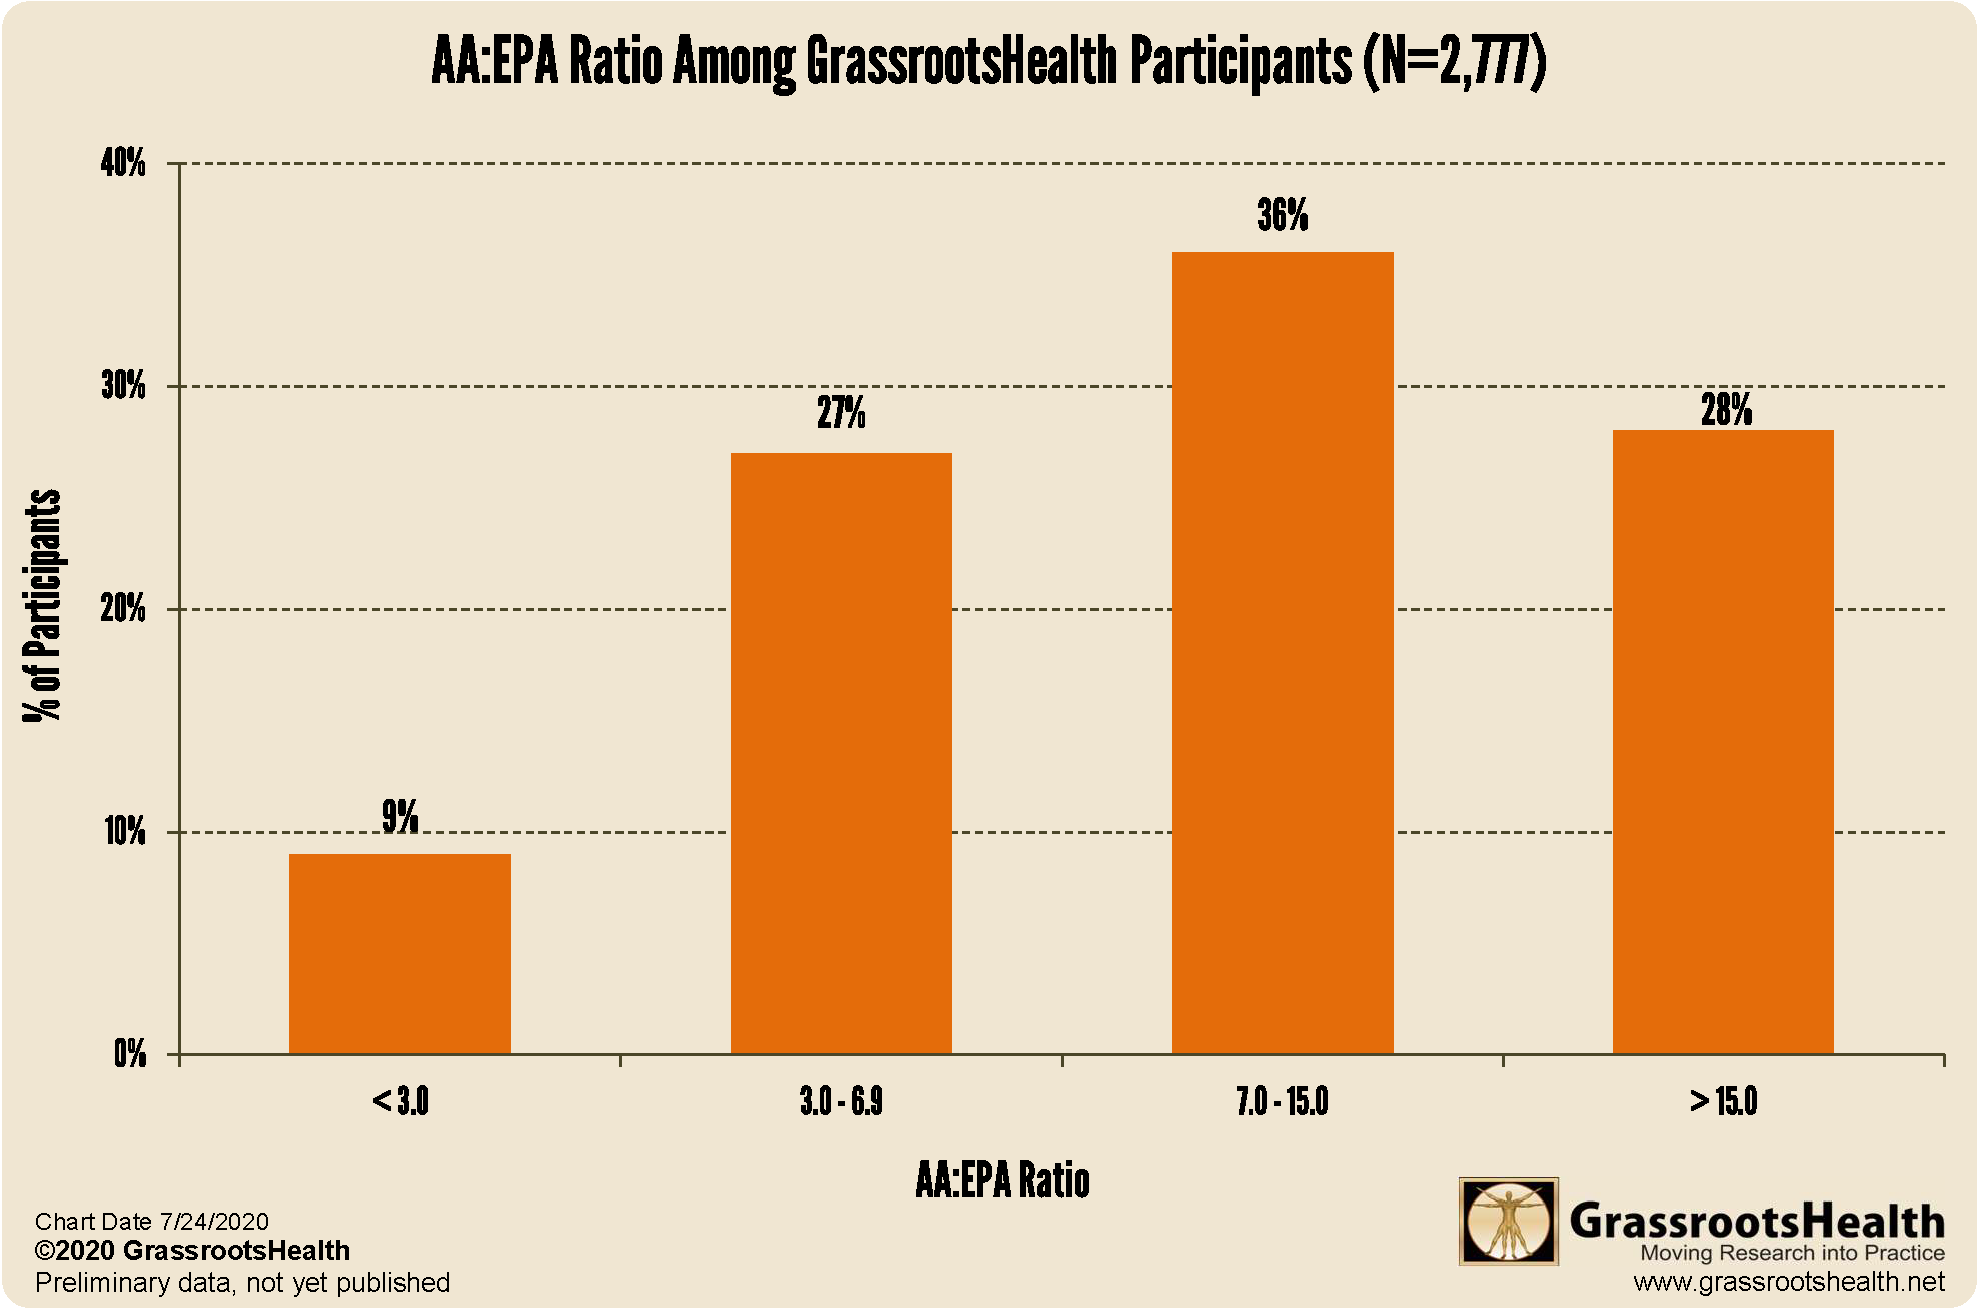
Among the 2,777 participants who tested their AA:EPA ratio, the average ratio was 9.5. As shown on the chart below, 9% have a ratio less than 3.0, 27% have a ratio between 3.0 and 6.9, 36% have a ratio between 7.0 and 15.0, and 28% have a ratio above 15.0.
Additionally, among those who completed two or more tests, 70% lowered their AA:EPA ratio after their first test. Of those who lowered their levels, 42% lowered them by 50% or more.
Nutrients to Support Your Health
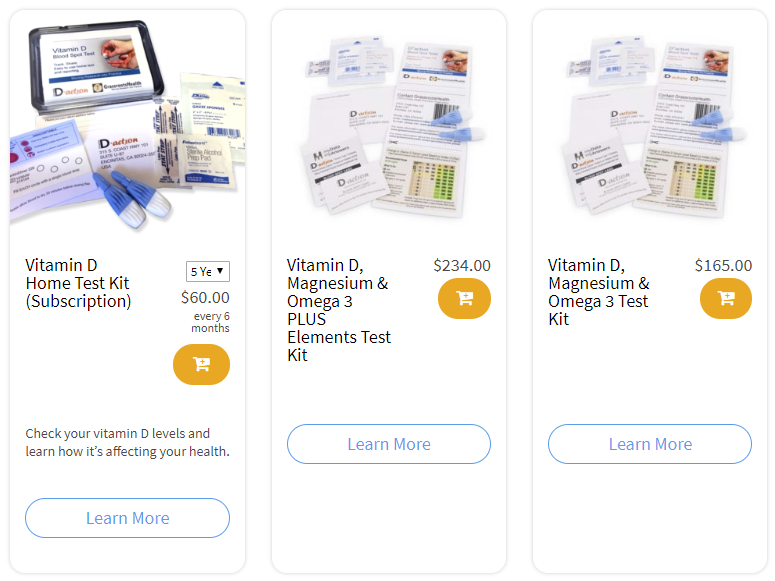
Do you know what your AA:EPA Ratio is? How about your levels of vitamin D, omega-3s and magnesium? How can you tell if you are getting enough? Create your custom home blood spot test kit to measure each of these health-protecting nutrients. Test today!
Are You Getting Enough Vitamin D to Help Yourself?
We’re in a time of great crisis that could be greatly affected by making sure you and everyone you know has a serum level of at least 40 ng/ml. Help us help you.
Do you know what your vitamin D level is? Be sure to test today to find out, and take steps to keep it within a target of 40-60 ng/ml or 100-150 nmol/L! Give your immune system the nutrients it needs to support a healthy you and protect yourself from unnecessary diseases.
GrassrootsHealth Nutrient Research Institute is preparing to do a Community RCT with the use of our myData-myAnswers nutrient health system that over 15,000 people are already using for their health. We will demonstrate how one can use the Nutrient Research Model established by Dr. Robert Heaney to establish the effect of vitamin D serum levels of at least 40 ng/ml (100 nmol/L) on risk reduction with different ethnicities in the population. Please let us know if you’re interested in helping sponsor this project.
![]()
CLICK HERE for updates and new information about the project.
Through GrassrootsHealth Nutrient Research Institute, you can also test your essential elements magnesium, copper, zinc and selenium, toxins such as lead, mercury and cadmium, as well as your omega-3 levels, inflammation levels and thyroid stimulating hormone (TSH) level. Find out your levels today! Log on to the test selection page (click the link below) to get your tests and see for yourself if your levels can be improved.
Make sure you track your results before and after, about every 6 months!
Click Here to Access the Test Page
How can I track my nutrient intake and levels over time?
To help you track your supplement use and nutrient levels, GrassrootsHealth has created the Personal Health Nutrient Decision System called

For each specific supplement, you can track what days you take it, how much, and many other details. This will help you know your true supplemental intake and what patterns of use work for you to reach and maintain optimum nutrient levels. Check it out today!
How Can You Use this Information for YOUR Health?
Having and maintaining healthy vitamin D and other nutrient levels can help improve your health now and for your future. Measuring is the only way to make sure you are getting enough!
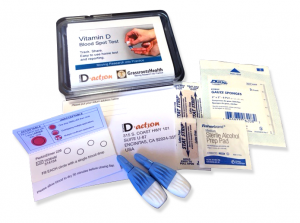
STEP 1 Order your at-home blood spot test kit to measure vitamin D and other nutrients of concern to you, such as omega-3s, magnesium, essential and toxic elements (zinc, copper, selenium, lead, cadmium, mercury); include hsCRP as a marker of inflammation or HbA1c for blood sugar health
STEP 2 Answer the online questionnaire as part of the GrassrootsHealth study
STEP 3 Using our educational materials and tools (such as our dose calculators), assess your results to determine if you are in your desired target range or if actions should be taken to get there
STEP 4 After 3-6 months of implementing your changes, re-test to see if you have achieved your target level(s)