Published on May 14, 2019

Drs. Cedric Garland and Sharif Mohr, along with others on their research team, have published numerous ecological studies on the association between UVB irradiance and the incidence of type 1 diabetes and many different types of cancer. The key figure from these studies is a U-shaped “smiley” curve showing higher disease rates in the far northern and southern latitudes – locations that have lower UVB irradiance from the sun. Following are some of the findings from these studies.
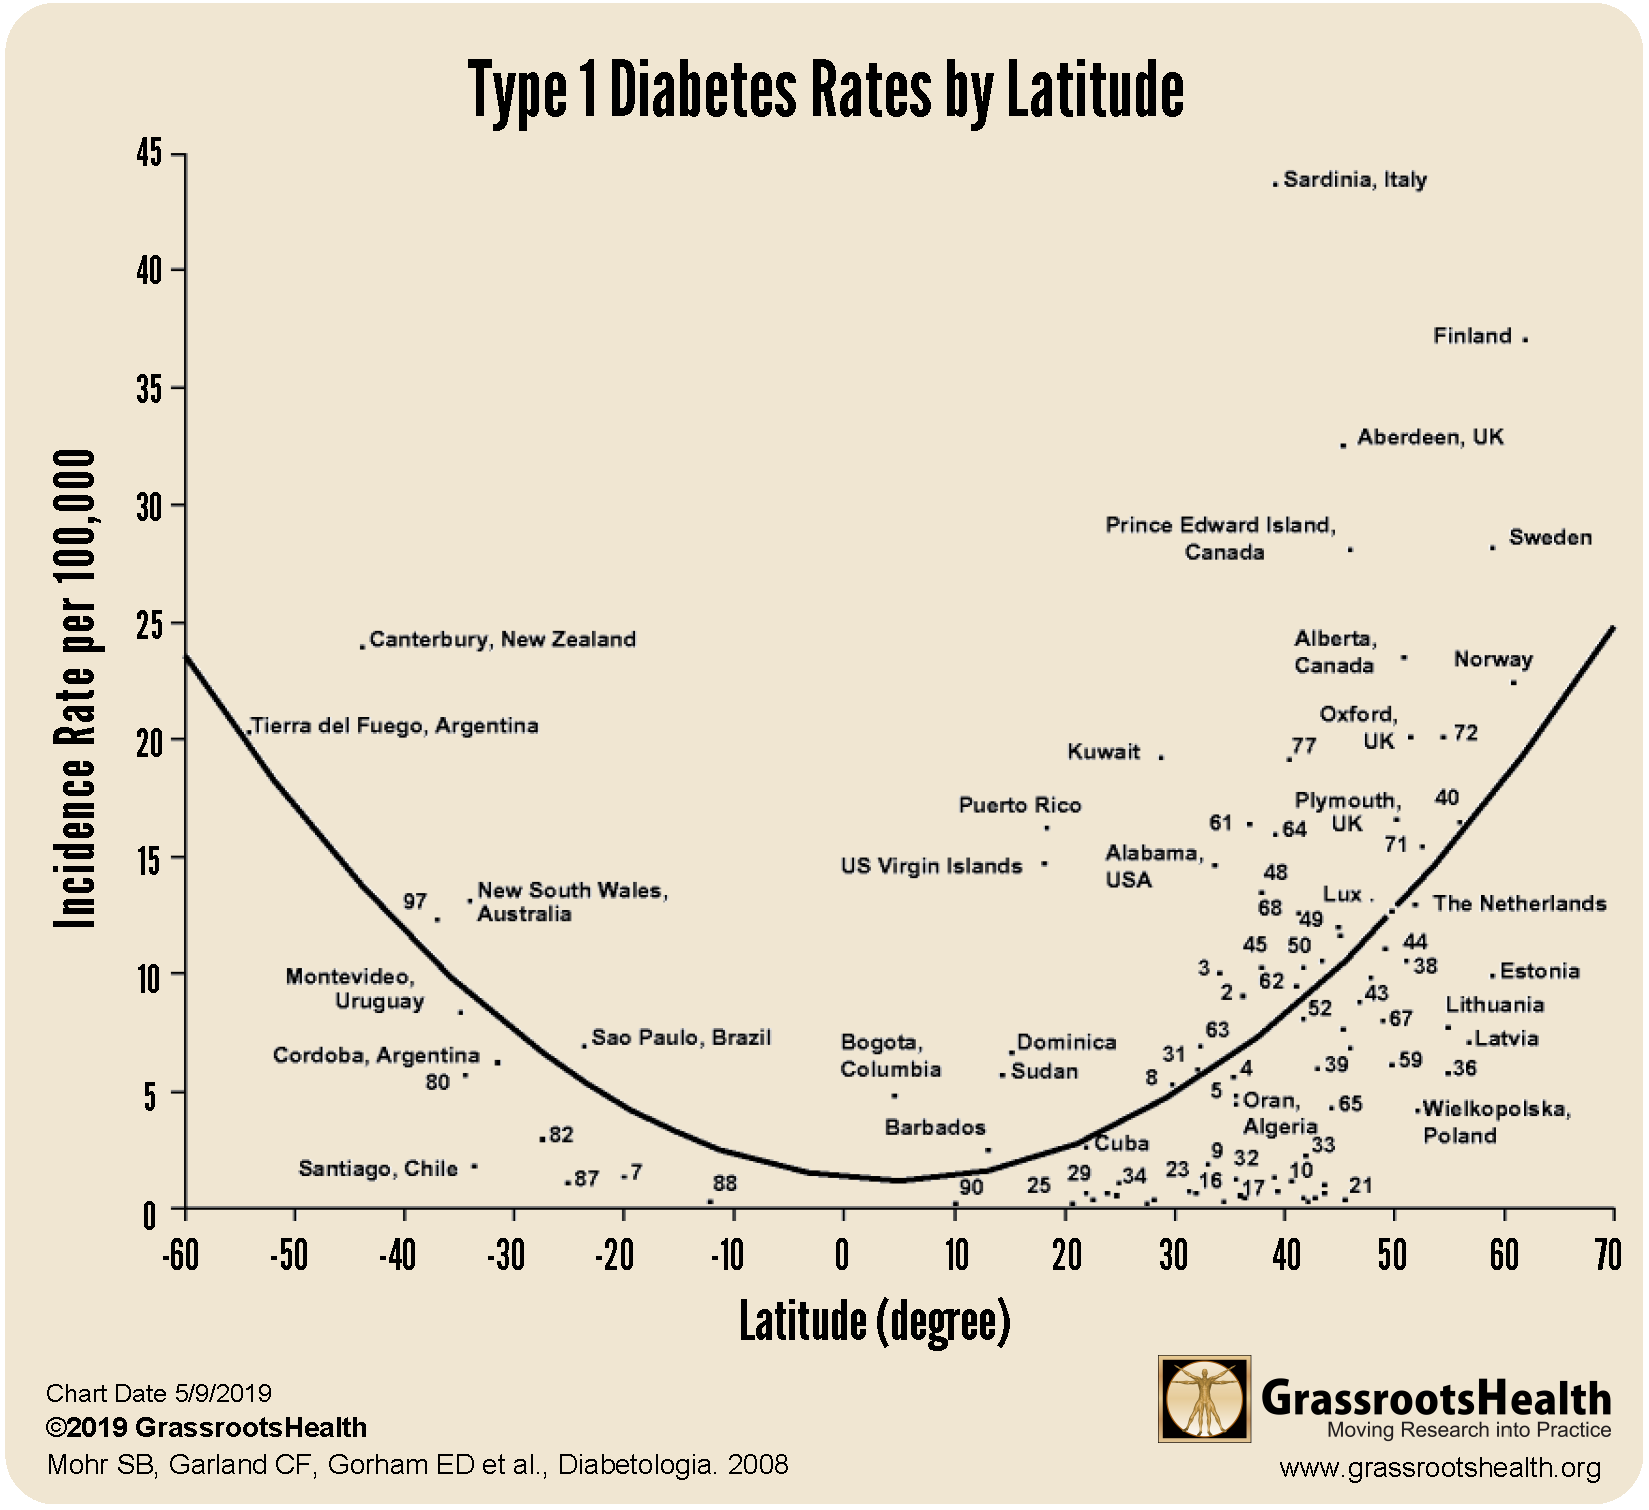
UVB and Type 1 Diabetes Rates
Published in 2008, the chart below shows the incidence rates of type 1 diabetes in children aged less than 14 years for 51 regions in the world. Incidence rates were higher at higher latitudes and close to zero near the Equator (P<0.001). Dr. Garland and his research team found that higher UVB irradiance, adjusted for cloud cover, was associated with lower incidence rates (P<0.05).
UVB and Cancer Rates
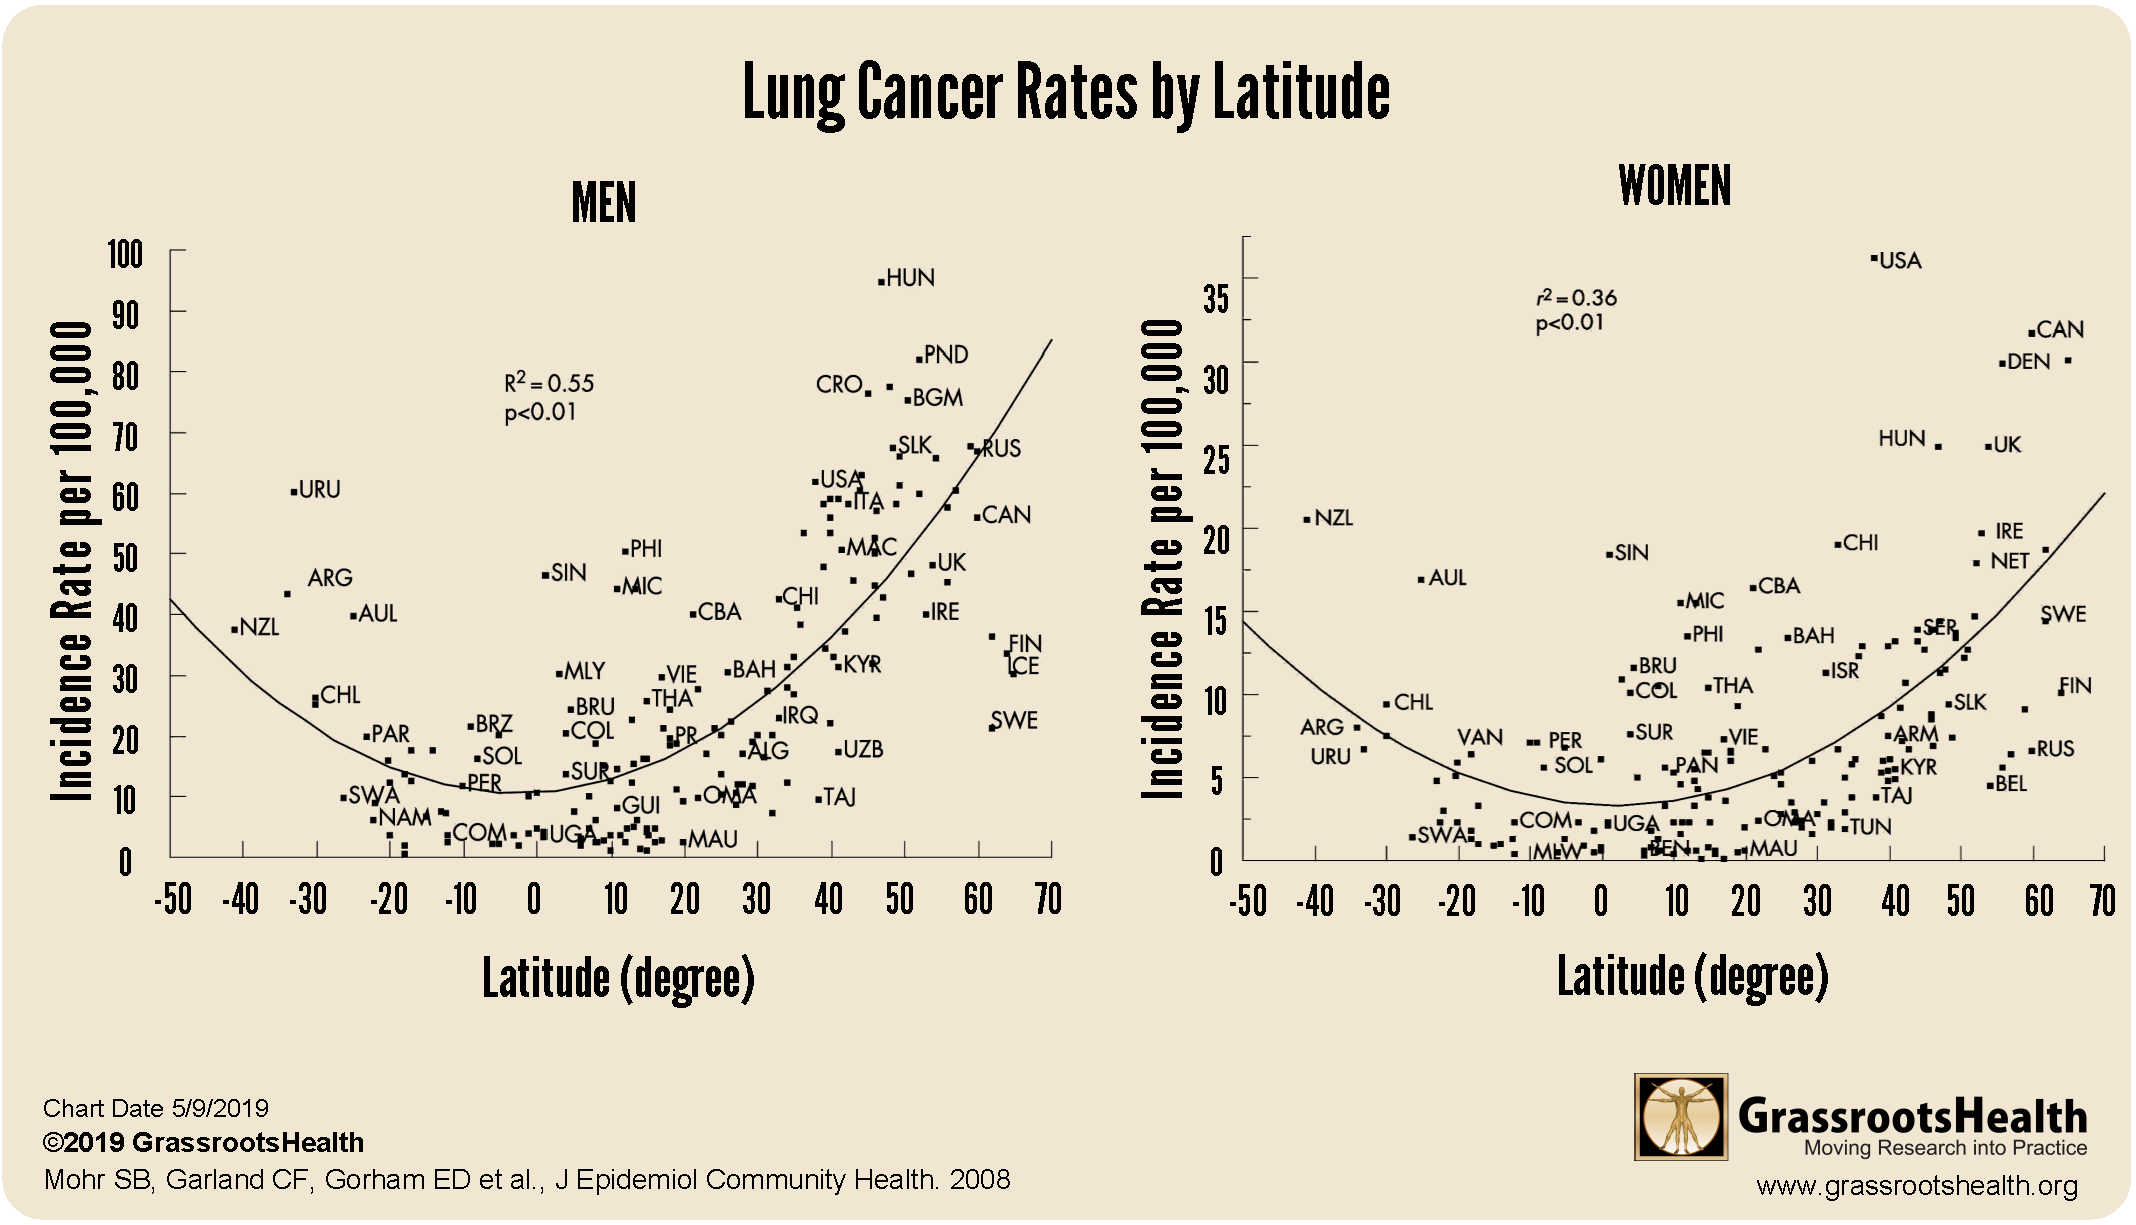
Similar to type 1 diabetes, regions at higher latitudes have also been found to have higher rates of many cancers. The charts below show that higher latitude was associated with higher incidence rates of lung cancer, the most common cancer worldwide and the leading cause of cancer death among men and women in 111 countries (P<0.01). Additionally, higher UVB irradiance was associated with a lower risk of lung cancer in both men and women (P<0.01) after adjusting for cloud cover, cigarette use, and other risk factors.
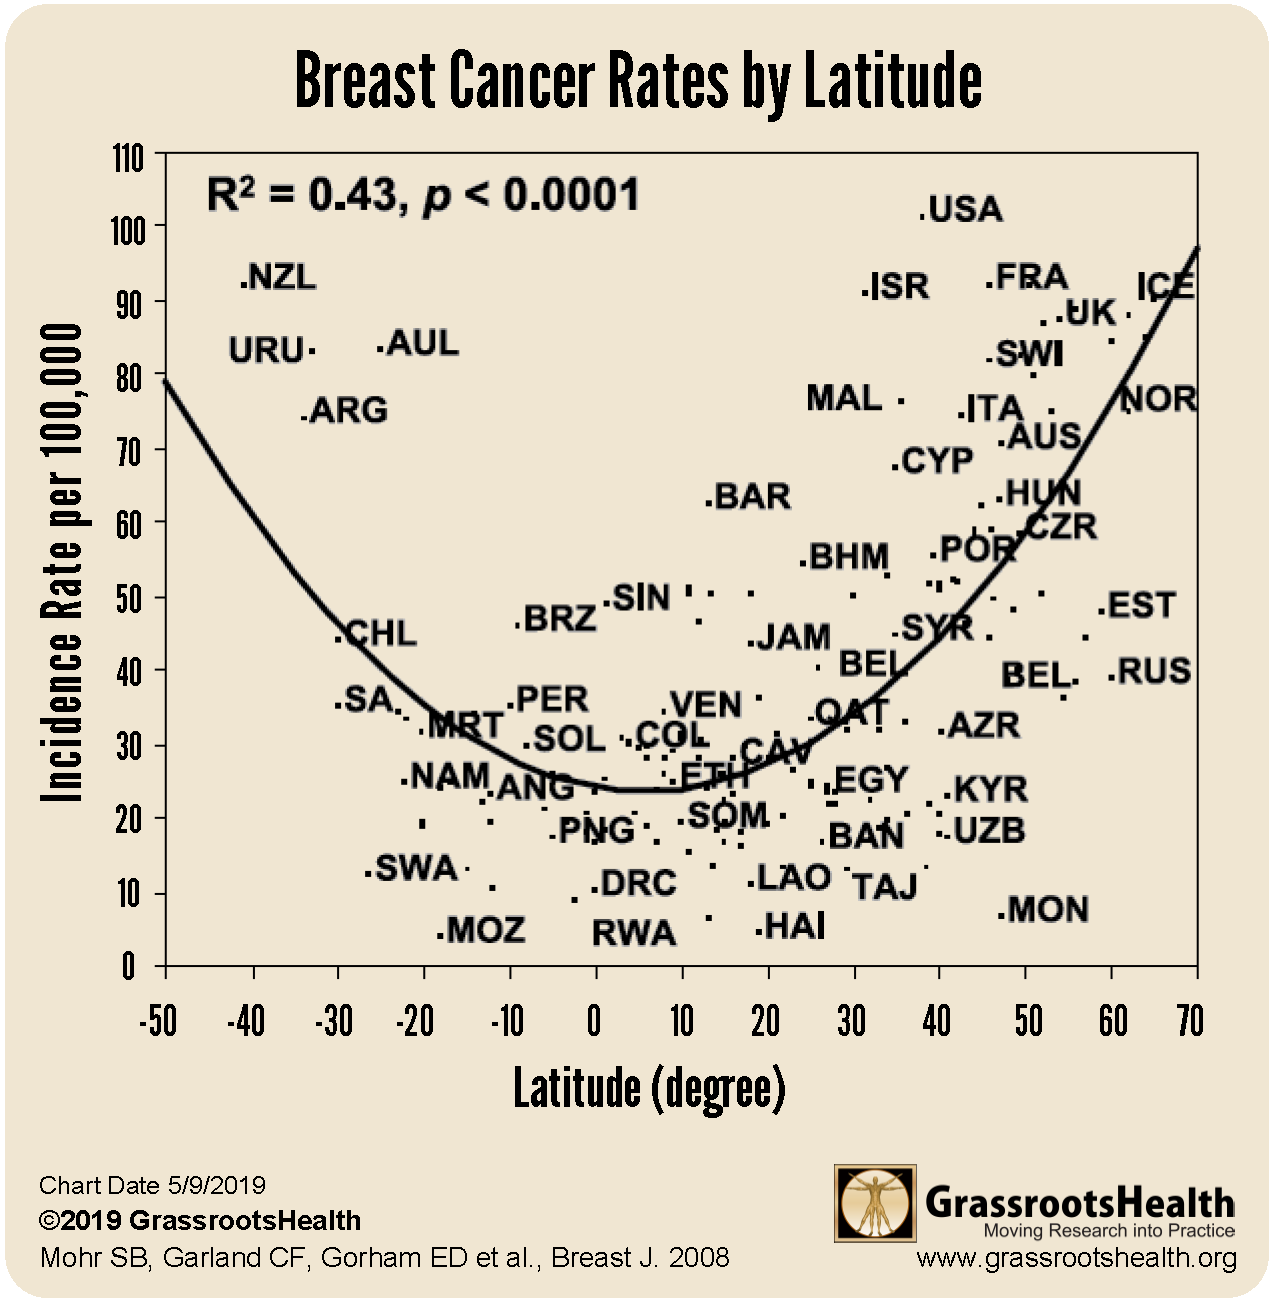
A similar pattern has also been found for incidence rates of breast cancer, the second most common cancer in the world and the fifth leading cause of cancer death. The chart below shows breast cancer rates were higher in countries with higher latitude across 107 countries (P<0.0001). Also, higher UVB irradiance was associated with lower breast cancer risk (P=0.04) after adjusting for cloud cover and other factors such as alcohol and cigarette use, consumption of animal-based foods, and obesity.
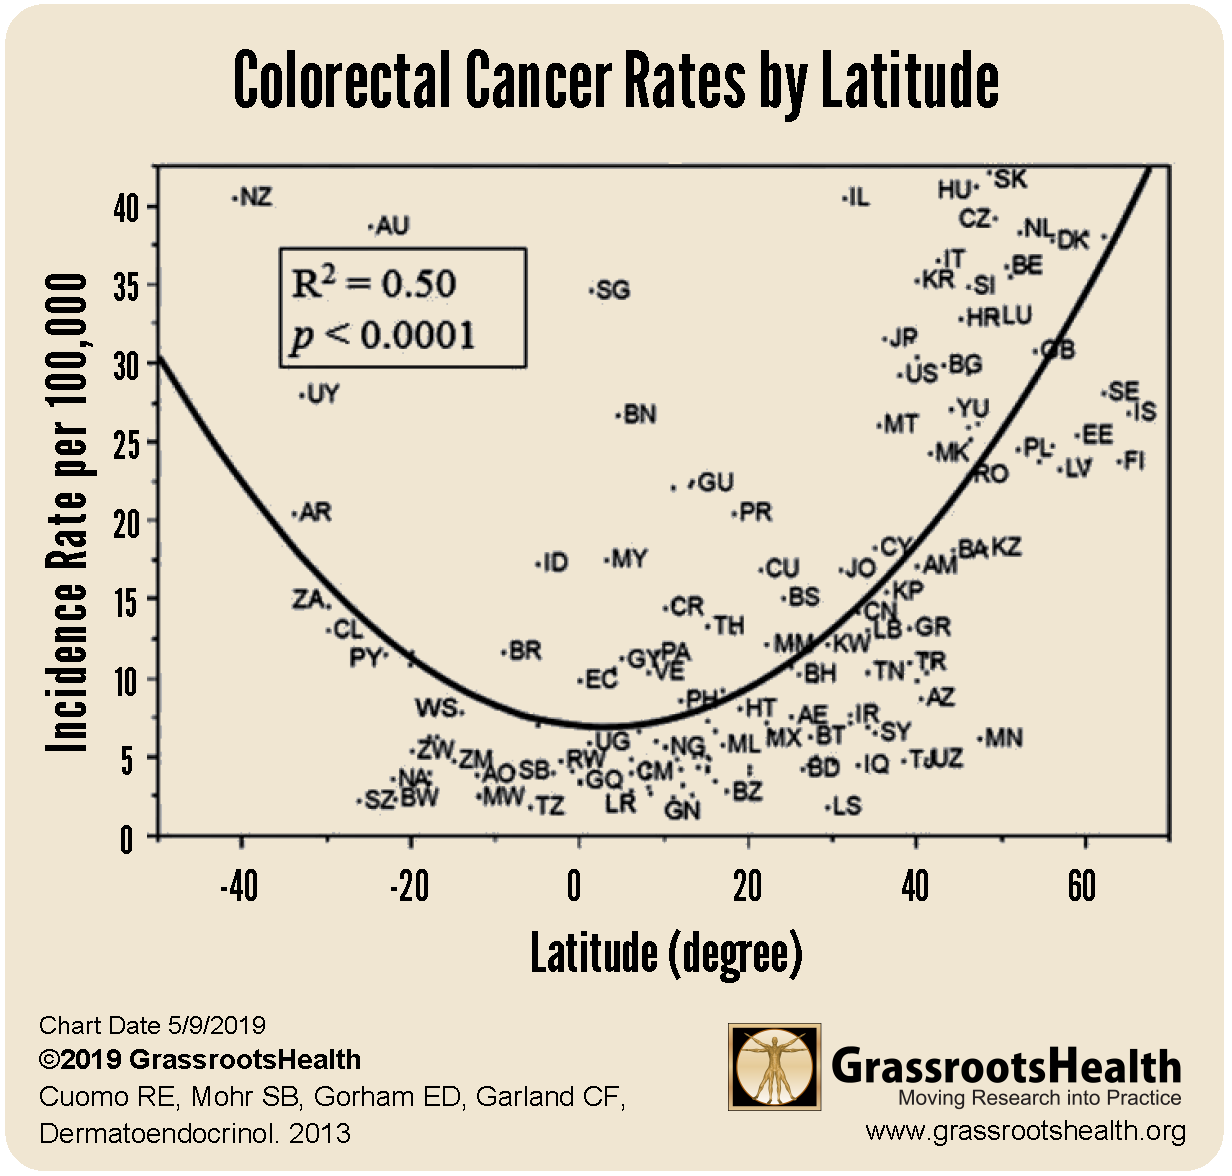
Rates of colorectal cancer, the third most common cancer worldwide and the second leading cause of cancer death, are higher further from the Equator across 173 countries (P<0.0001). Additionally, higher UVB irradiance was associated with lower colorectal cancer risk (P<0.0001) after adjusting for cloud cover and other relevant factors.
Dr. Garland and his research team have also published similar results for ovarian cancer, endometrial cancer, renal cancer, bladder cancer, pancreatic cancer, brain cancer, leukemia, and multiple myeloma. The repeated pattern shown in these charts clearly show the association between UVB irradiance from the sun and rates of type 1 diabetes and many cancers. Increasing sun exposure at a population level may substantially decrease the rates of these diseases.
Are you using sun exposure as a source of vitamin D?
Is sun exposure helping to improve your vitamin D level? Make sure you know your vitamin D level, and see if you are in the target range of 40-60 ng/ml (100-150 nmol/L). Find out your levels today! Log on to the shop (click the link below) to get your tests and see for yourself if your levels can be improved. Use coupon code SunMonth to receive 15% off during Sunshine Month only!
Make sure you track your results before and after, about every 6 months!

Click Here to Access the Shop Page
How can I track my sun exposure and my vitamin D levels?
To help you track your sun exposure and nutrient levels, GrassrootsHealth has created an online tracking system called myData-myAnswers. You can also track your supplemental and dietary nutrient intake to see how they impact your nutrient levels. Check it out today!
How Can You Use this Information for YOUR Health?
Having and maintaining healthy vitamin D and other nutrient levels can help improve your health now and for your future. Measuring is the only way to make sure you are getting enough!
STEP 1 Order your at-home blood spot test kit to measure vitamin D and other nutrients of concern to you, such as omega-3s, magnesium, essential and toxic elements (zinc, copper, selenium, lead, cadmium, mercury); include hsCRP as a marker of inflammation or HbA1c for blood sugar health
STEP 2 Answer the online questionnaire as part of the GrassrootsHealth study
STEP 3 Using our educational materials and tools (such as our dose calculators), assess your results to determine if you are in your desired target range or if actions should be taken to get there
STEP 4 After 3-6 months of implementing your changes, re-test to see if you have achieved your target level(s)